 1
1 2
2 3
3 4
4 5
5 6
6 7
7 8
8 9
9 10
10 11
11 12
12 13
13 14
14 15
15 16
16 17
17 18
18 19
19 20
20 21
21 22
22 23
23 24
24 25
25 26
26 27
27 28
28 29
29 30
30 31
31 32
32 33
33 34
34 35
35 36
36 37
37 38
38 39
39 40
40 41
41 42
42 43
43 44
44 45
45 46
46 47
47 48
48 49
49 50
50 51
51 52
52 53
53 54
54 55
55 56
56 57
57 58
58 59
59 60
60 61
61 62
62 63
63 64
64 65
65 66
66 67
67 68
68 69
69 70
70 71
71 72
72 73
73 74
74 75
75 76
76 77
77 78
78 79
79 80
80 81
81 82
82 83
83 84
84 85
85 86
86 87
87 88
88 89
89 90
90 91
91 92
92 93
93 94
94 95
95 96
96 97
97 98
98 99
99 100
100 101
101 102
102 103
103 104
104 105
105 106
106 107
107 108
108 109
109 110
110 111
111 112
112 113
113 114
114 115
115 116
116 117
117 118
118 119
119 120
120 121
121 122
122 123
123 124
124 125
125 126
126 127
127 128
128 129
129 130
130 131
131 132
132 133
133 134
134 135
135 136
136 137
137 138
138 139
139 140
140 141
141 142
142 143
143 144
144 145
145 146
146 147
147 148
148 149
149 150
150 151
151 152
152 153
153 154
154 155
155 156
156 157
157 158
158 159
159 160
160 161
161 162
162 163
163 164
164 Operating Costs of
Page 110
Page 112
If you've noticed an error in this article please click here to report it so we can fix it.
MOTORBUS, TROLLEYBUS
and TRAMCAR
By H. Scott Hall,
M.I.A.E.
A Rational Method of Comparing the Costs of Operation of the Principal. Types of Vehicle Employed for Urban Passenger Transport IDO not recall ever having seen any description of a method of comparing the relative merits of the trolleybus, motorbus and tramcar, on the basis of cost of operation. Whenever the subject is discusseden comparison of costs is invariably evaded, or, if it be tackled, insufficient information is given of the basis .. of calculation to enable the unbiased observer to draw a positive con
elusion. .
It is commonly urged on behalf of the tramcar and trolleybus (a) that home-produced fuel is consumed in providing the power for their propulsion, and (b) that by their employment the peak loads at the local generating station are modified.
Arguments Given UndueValue.
Neither of these considerations seems to me to be germane to the issue. Even if the fact that these vehicles consume home-produced feel be accepted as of consequence, it is an advantage which is likely to diminish in value when Plans for the production of fuel oil and petrol from coal come to fruition. As for the consideration for the generating station, surely in these days ielf the widespread and ine.reasing use of electricity for all purposes, and in view of the development of the grid, scheme, it is fair to suggest that those enterprises should be expected to succeed independently of this more or less adventitious support from local transport. It is perfectly true that figures for the working expenditure on trolleybuses, buses and trams are available. Indeed, hardly any type of transport E52 affords the public such opportunities of ascertaining cost of operation as do these three forms.
So far as troIleybuses and trains are concerned, that information relating to each and every undertaking is available annually in a Government publication. Municipalities and many bus-operating companies also publish corresponding figures, and almost every issue of The Corrimercial Motor affords some data on thic point. Notwithstanding this plethora of information, rational comparison between them on a basis of cost is not practicable using the published. figures as they stand.
• Every class of vehicle user is well aware that the annual mileage in -lation to any particular vehicle is an important factor in deterniining its true cost and that even where the mileage is known comparison between one set of figures and another is impossible unless details of the individual items of cost are comparable.
It has always seemed to me that there ought to be a rational method of comparing the costs of operating these types and I have evolved a method which, in principle at least, can be applied to all normal condi tions of operation. .
Readers of The Commercial Motor are familiar with the orthodox and rational system of calculating operating costs as applied to buses. The same principles can be applied to the trolleybus and the tram. There is, of course, this difference: that in the case of the trolleybus cognizance has to be taken of the need for the provision of overhead wire. equipment, whilst, so far as the tram is concerned, there is overhead wire equipment and track. It is convenient to consider these additional items inde
pendently. • • An average figure, for the capital untlay:Cin traanwaf track is £13,000 per mile and for its overhead equipment £2,000 per mile. The corresponding figures for maintenance are :£600 per mile per annum in the case of the track and £140 per mile per. annum in the case of the equipment.
Charges Per Annum Per Mile.
It is convenient to reduce these items to an equivalent annual charge per mile per annum. For that I propose to assume an average life of 15 years for both track and overhead equipment and I shah take an average debit on account of interest on first cost on the basis of 2i per cent.
On this basis the following are the annual charges, on account of traele and overhead equipment together :— Depreciation, 21,000; interest, 1300; maintenance, £740; total, £2,040 per mile per annum. In the case of the trolleybus the overhead equipment is somewhat more expensive than that of the tram, largely because there are four overhead wires instead of two, and an average figure is £2,500 per mile, the maintenance being about the same as in the case of the tramway. OR this basis, then, taking as before a life of 15 years, the depreciation is R166; interest, £63; maintenance, £140; total, 2369 per mile per annum.
Keeping the above figures, in mind it is now necessary to arrive at reasonable approximations for the running cost of particular types of vehicle. For convenience of comparison I have taken in all cases vehicles having a seating capacity of 56 to 60. The following are fair averages.
Take first the tram.' Allowing depreciation on a basis of 300,000 miles life per vehicle and taking £2,000 as being the cost of a tram, the depreciation per mile is 1.60d. Current consumption is at the rate of 1.88 unit per mile and taking the cost of current to be id. per B.T.U. that gives us a figure for power of 1.88q. per mile. Maintenance averages 1.50d. per mile and the total running cost, therefore, is 4.98d. per mile.
For standing charges we have to take into account taxation, which in the case of a tram is negligible, interest on first cost, which calculated as above is f50 per annum, and wages: For the calculation of wages I am going to assume that the conditions are such that for all three types of vehicle there is average employment throughout the year for two drivers and two conductors per vehicle. The wage figure on that basis can be taken to be £650, so that the total of standing charges is £700.
e54.
Yet another assumption is necessary and must be introduced at this point, and that is an annual mileage. I am going to assume that each vehicle covers 30,000 miles per annum. On that basis the total operating cost of the tram, apart from the expenditure on track and overhead equipment, is 10.58d. per mile.
In the ease of the trolleybus, taking the first cost as £2,050 and assuming a life of 250,000 miles, the following are the operating costs :—Running costs : depreciation, 1.97d.; power, 2.18 units per mile at 1d. per unit, 2.18d.; maintenance, 1.37d.; tyres, 0.63d.; total, 6.1.5d. For standing charges there is the tax, £96 per annum_; wages, £650; interest, £51; total, £797. Taking as before an
annual mileage of 30,000, the total operating cost per mile, exclusive of charges on account of the overhead equipnient, is 12.52d.
For a petrol bus costing £1,800 and assuming a life of 200,000 miles the running costs are :—Fuel, 2.70d.; maintenance, 2.33d.; tyres, 0.63d.; engine oil, 0.10d. ; depreciation, 2.16d.; total, 7.92d. The standing charges are : tax, £96; wages, 650; interest, £45; total, £791, and the total operating cost per mile is 14.25d.
Finally there is the oil-engined bus to be taken into consideration. This costs a little more at first, say, £2,000 per bus, as against £1,800 for the petrol, but, of course, its fuel consumption is less. Running costs are as follow :—Fuel, 1.00d.; maintenance, 2.33d.; tyres, 0.63d.; lubri
eating oil, 0.10d.; and depreciation, 2.40d.; total, 6.46d. The standing charges are : tax, £164; wages, £650; interest on first cost, £50; total, £864. The total cost per mile is 13.37d. •
There still remains the necessity of assessing the incidence per mile of the cost of the track and overhead equipment in the case of the tram and the overhead equipment in the case of the trolleybus. For this purpose two other factors have to be taken into consideration. The number of vehicles required to operate a particular route and the length of the route.
Formula of Track Cost per Mile. The cost per mile may be expressed as a formula, being in the
2040 x X 240 case of the train N x 30,000 This gives the cost per mile, where M is the length of the route in miles and N the number of vehicles commonly employed.
The corresponding figures for a 369xMx240 trolleybus are . The N x 30,000 results of these calculations must be added to the operating costs of the vehicles concerned as calculated above.
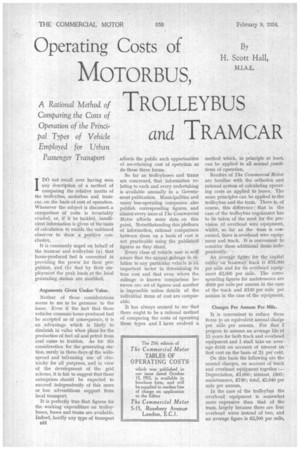
As an example it may be of interest to assume a route 10 miles long operated by 20 vehicles. In the case of the tram route that would be equivalent to an additional cost of 8.16d. per mile, so that the total cost per mile is 18.72d. If the route were operated by trolleybuses the cost per mile on account of the overhead equipment would be 1.48d. per mile, bringing the total to 14d. per mile.
Diagrammatic Illustration the Most Satisfactory.
To cite one particular example, however, is not to take maximum advantage of the method of calculation. The comparative merits of the three systems involved are best illustrated by diagram as shown herewith. There, costs of operation are plotted in respect of a 10-mile route, indicating how that cost varies according to the number of vehicles employed.
The matter of operating costs cannot, of course, ever be the sole deciding factor. In a subsequent article I hope to present some of the other 'relative factors, considering them in such a way as to enhance the value of this method of dealing with the question of cost.