 1
1 2
2 3
3 4
4 5
5 6
6 7
7 8
8 9
9 10
10 11
11 12
12 13
13 14
14 15
15 16
16 17
17 18
18 19
19 20
20 21
21 22
22 23
23 24
24 25
25 26
26 27
27 28
28 29
29 30
30 31
31 32
32 33
33 34
34 35
35 36
36 37
37 38
38 39
39 40
40 41
41 42
42 43
43 44
44 45
45 46
46 47
47 48
48 49
49 50
50 51
51 52
52 53
53 54
54 55
55 56
56 57
57 58
58 59
59 60
60 61
61 62
62 63
63 64
64 65
65 66
66 67
67 68
68 69
69 70
70 71
71 72
72 73
73 74
74 75
75 76
76 77
77 78
78 79
79 80
80 81
81 82
82 83
83 84
84 85
85 86
86 87
87 88
88 89
89 90
90 91
91 92
92 93
93 94
94 95
95 96
96 97
97 98
98 99
99 100
100 101
101 102
102 103
103 104
104 105
105 106
106 107
107 108
108 109
109 110
110 111
111 112
112 113
113 114
114 115
115 116
116 117
117 118
118 119
119 120
120 121
121 122
122 123
123 124
124 125
125 126
126 127
127 128
128 129
129 130
130 131
131 132
132 133
133 134
134 135
135 136
136 137
137 138
138 139
139 140
140 141
141 142
142 143
143 144
144 145
145 146
146 147
147 148
148 149
149 150
150 151
151 152
152 153
153 154
154 155
155 156
156 157
157 158
158 159
159 160
160 161
161 162
162 163
163 164
164 165
165 166
166 167
167 168
168 169
169 170
170 171
171 172
172 173
173 174
174 175
175 176
176 177
177 178
178 179
179 180
180 181
181 182
182 183
183 184
184 185
185 186
186 187
187 188
188 189
189 190
190 191
191 192
192 193
193 194
194 195
195 196
196 PERFORMANCE: WHAT IT REALLY MEANS.
Page 114

Page 115
Page 116
Page 117
If you've noticed an error in this article please click here to report it so we can fix it.
A Treatment in Non-technical Terms of a Subject of Great Importance to All Users.
T"question whether a certain type of vehicle is exactly suited to the special conditions under which it will be used for the majority of its life is a most important one for the prospective purchaser to consider. With the ordinary motorcar, it is a simple matter for anyone contemplating purchase to ask for a test run with a reasonable hope of getting an accurate impression of the be-' haviour of the car under actual working conditions similar to those upon which it will be daily engaged. The case of the commercial vehicle user, however, is entirely different, as loads vary enormously and the demands of the country—hilly or flat, twisting or straight roads, with further variation of surfaces— cause a great amount of uncertainty at the time of purchase, and introduce the doubt as to whether the correct vehicle is being chosen.
Performance, as generally understood, connects the two factors, power and weight, and actually a very good idea of the capacity of any vehicle under discussion can be obtained in a comparative sense by ascertaining the power-weight ratio. Now, this ratio has contained within it a series of factors which, of course, differ on various vehicles, and it is a matter where, by analysing the factors, a true conception of the performance of a vehicle can be obtained.
Very largely, the top-gear performance (or for that matter any of the indirect ratio performances as well) is tied up with powers of acceleration, so that, if the acceleration curve be known on the various vehicles (the purchase of one of which is contemplated), then a very good idea of what the top-gear performance is likely to be can be obtained. Further, the horse-power of the engine at various road speeds is nearly always available (from the engine manufacturers), whilst the horse-power required to propel the vehicle at certain speeds on different road surfaces can easily be computed. Then, by comparing the two—that is, placing the engine horse-power curve and the road wheel horse-power curve one above the other—there can be obtained a representative proportion of actual b.h.p. delivered at the flywheel to actual b.h.p. required by the road wheels al any speed of which the vehicle is capable, thereby giving an indication of the power available for acceleration and hill-climbing.
Before proceeding farther in the discussion of performance, it may prove illuminating to turn back to one of the older types of commercial vehicle engine and compare it with the modern type, noting in the meantime where improvement has occurred. Quite apart from a general increase in b.h.p. from a given engine capacity, the maximum power has been spread over a very much wider range of revolution speeds. This has been made possible by a reduction in inertia stresses attendant upon the better understanding of metals, of their Strength and proportion necessary to withstand certain loads. For instance, pistons—a reciprocating weight which governs the maximum speeds of the engine—have become very much lighter, In fact several instances are known to the writer where aluminium pistons are now being fitted to engines in place of east-iron ones (the latter weighing over twice as much as the new aluminium ones). This does not mean, however, that the revolution speed may be doubled for similar inertia stresses, but a much higher rate of revolution will be obtained nevertheless (the speed actually ,varies in direct proportion to the square of the linear velocity of the moving part, load for load).
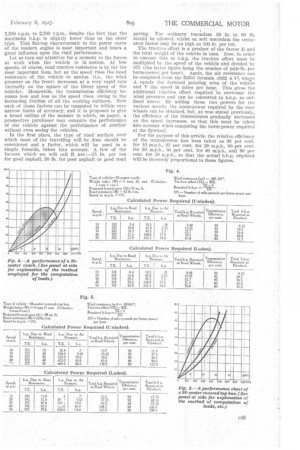
As a matter of example, two curves are shown in Pig 1, where the maximum b.h.p. of both is, broadly speaking, the same, but where one engine is an old type with cylinders of 121 mm. bore, the piston stroke being 152 mm., fitted with cast-iron pistons, and the other engine has a bore of 110 min, and a stroke of 130 mm., and is fitted with aluminium pistons. The maximum power of the engine with cast-iron pistons is slightly higher than the one with aluminium pistons, which divergence can be accounted for by the difference in capacity of the cylinders, but—here is the important point—the power peak of the engine fitted with castiron pistons occurs at 1,600 r.p.m. and the power tails away very rapidly after that point, whereas, with the other engine, the peak, is reached at about 1,800 r.p.m. and continues practically fiat until approximately 2,900 r.p.m.
Looking at the matter in a slightly different light, in the portion of the curve hatched-in at the peak, it will be seen that 60 b.h.p. is available over a speed range of about 900 r.p.m., i.e., from 1,100 r.p.m. to 2,000 r.p.m., whilst on the modern engine 60 b.h.p. is available over a speed range of 1,400 r.p.m., i.e., from 1,300 r.p.m. to 2,700 r.p.m., despite the fact that the maximum b.h.p. is slightly lower than on the older type. This fiat-top characteristic to the power curve of the modern engine is most important and bears a great influence upon the road performance. Let us turn our attention for a moment to the forces at work when the vehicle is in motion. At low speeds, of course, road tractive resistance is by far the most important item, but as the speed rises the head resistance of the vehicle to motion (i.e., the wind pressure on the front) increases at a very rapid rate (actually as the square of the linear speed of the vehicle). Meanwhile, the transmission efficiency becomes less and less as the speed rises, owing to the increasing friction of all the working surfaces. Now each of these factors can be computed to within very narrow limits of accuracy, and it is proposed to give a broad outline of the manner in which, on paper, a prospective purchaser may compare the performance of one vehicle against the performance of another without even seeing the vehicles.
In the first place, the type of road surface over which most of the travelling will be done should be „considered and a factor, which will be used in a siinple formula, taken into account. A few of the factors which we will call R are lb. per ton for good asphalt, 30 lb. for poor asphalt or good road paving. For ordinary macadam 50 lb. to 60 lb. should be allowed, whilst on soft macadam the resistance factor may be as high as 100 lb. per ton.
The tractive effort is a product of the factor fl and the total weight of the vehicle in tons. Now, in order to convert this to b.h.p.the tractive effort must be multiplied by the speed of the vehicle and divided by 375 (the latter figure being the number of per horse-power per hour). Again, the air resistance can be computed from the Eiffel formula .0032 A V2, whcre A equals the forward pointing area of the vehicle and V the speed in miles per hour. This gives the additional tractive effort required to overcome the wind pressure and can be converted to b.h.p. as outlined above. By adding these two powers for the various speeds, the horse-power required by the rear wheels can be obtained, but, as was stated previously, the efficiency of the transmission gradually decreases as the speed increases, so that this must be taken into account when computing the horse-power required at the flywheel.
For the purpose of this article, the relative efficiency of the transmission has been taken as 93 per cent. for 10 m.p.h., 02 per cent. 'for 20 m.p.h., 90 per cent. for 30 m.p.h., .86 per cent. for 40 m.p.h., and 80 per cent. for 50 m.p.h., so that the • actual b.h.p. required will be inversely proportional to these figures. • Now, by taking the horse-power curve of the engine and plotting it in terms of m.p.h., an excess of power at the smaller range of speeds, say, up to 45 m.p.h., will be present, the amount of power in excess of the amount required. giving an indication of the perform ance on hills and acceleration on the level of the vehicle. Several tables of figures have been computed in order to obtain the relative factors in the power-weight ratio. Take, for instance, 2. At 20 m.p.h, the required horse-power (for a laden vehicle) is only two-fifths of the available horse-power, whilst at 40 m.p.h. the ratio is reduced until the required power is considerably over three-fifths of the available power. At 50 m.p.h. there is practically no excess power Over that required, and at a little higher speed the two curves meet, which point is the theoretical maximum speed of the vehicle.
For the purpose of comparison, a two-litre touring car performance curve is also included (Fig. 3) and shows that at 20 m.p.h. the required horse-power is only two-sevenths of the available horse-power, and at 40 m.p.h. even the available horse-power is practically double that which is required. Again, the maximum speed of the vehicle is indicated at the point where the two curves cross, i.e., at approximately 56 m.p.h. Referring to Figs. 4 and 5, the particulars of the vehicles are given in panels at the side and provide an indication of the method employed for computing the curves.
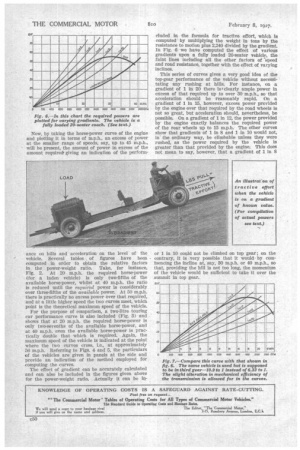
The effect of gradient can be accurately calculated and can also be included in the figures given above for the power-weight ratio. Actually it can be in eluded in the formula for tractive effort, which is computed by multiplying the weight in tons by the resistance to motion plus 2,240 divided by the gradient In Fig. 6 we have computed the effect of various gradients upon a fully loaded 20-seater vehicle, the faint lines including all the other factors of -speed and road resistance, together with the effect of varying inclines.
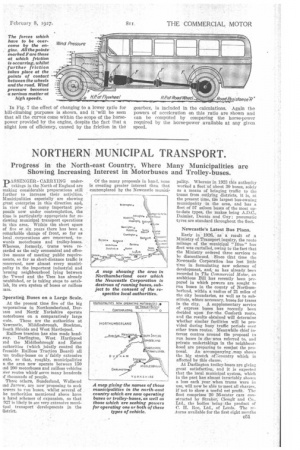
This series of curves gives a very good idea of the top-gear performance of the vehicle without necessitating any rushing at hills. For instance, on a gradient of 1 in 20 there 1sT clearly ample power in excess of that required up to over 30 m.p.h., so that acceleration should be reasonably rapid. On a gradient of 1 in 15, however, excess power provided by the engine over that required by the road wheels is not so great, but acceleration should, nevertheless, be possible. On a gradient of 1 in 12, the power provided by the engine exactly balances the required power of the rear wheels up to 15 m.p.h. The other curves show that gradients of 1 in 8 and 1 in 10 would not, in the ordinary way, be climbable unless they were rushed, as the power required by the vehicle is greater than that provided by the engine. This does not mean to say, however, that a gradient of 1 in 8 or 1 in 10 could not be climbed on top gear ; on the contrary, it is very possible that it would by corninencing the incline at, say, 30 m.p.h. or 40 m.p.h., so that, providing the hill is not too long, the momentum of the vehicle would be sufficient to take it over the summit in top gear. In Fig. 7 the effect of changing to a lower r,atio for hill-climbing purposes is shown, and it 'will be seen that all the curves come within the scope of the horsepower provided by the engine, despite the fact that a slight loss of efficiency, caused by the friction in the gearbox, is included in the calculations. Again the powers of acceleration on this ratio are shown and can be computed by comparing the horse-power required by the horse-power available at any given speed.