 1
1 2
2 3
3 4
4 5
5 6
6 7
7 8
8 9
9 10
10 11
11 12
12 13
13 14
14 15
15 16
16 17
17 18
18 19
19 20
20 21
21 22
22 23
23 24
24 25
25 26
26 27
27 28
28 29
29 30
30 31
31 32
32 33
33 34
34 35
35 36
36 37
37 38
38 39
39 40
40 41
41 42
42 43
43 44
44 45
45 46
46 47
47 48
48 49
49 50
50 51
51 52
52 53
53 54
54 55
55 56
56 57
57 58
58 59
59 60
60 61
61 62
62 63
63 64
64 65
65 66
66 67
67 68
68 69
69 70
70 71
71 72
72 73
73 74
74 75
75 76
76 77
77 78
78 79
79 80
80 81
81 82
82 83
83 84
84 85
85 86
86 87
87 88
88 89
89 90
90 91
91 92
92 93
93 94
94 95
95 96
96 97
97 98
98 99
99 100
100 101
101 102
102 103
103 104
104 105
105 106
106 107
107 108
108 109
109 110
110 111
111 112
112 113
113 114
114 115
115 116
116 117
117 118
118 119
119 120
120 121
121 122
122 123
123 124
124 125
125 126
126 127
127 128
128 129
129 130
130 131
131 132
132 133
133 134
134 135
135 136
136 137
137 138
138 139
139 140
140 141
141 142
142 143
143 144
144 145
145 146
146 147
147 148
148 149
149 150
150 151
151 152
152 153
153 154
154 155
155 156
156 157
157 158
158 159
159 160
160 161
161 162
162 163
163 164
164 165
165 166
166 167
167 168
168 169
169 170
170 171
171 172
172 173
173 174
174 175
175 176
176 177
177 178
178 179
179 180
180 181
181 182
182 183
183 184
184 185
185 186
186 187
187 188
188 189
189 190
190 191
191 192
192 193
193 194
194 195
195 196
196 197
197 198
198 199
199 200
200 201
201 202
202 203
203 204
204 205
205 206
206 207
207 208
208 209
209 210
210 211
211 212
212 213
213 214
214 215
215 216
216 217
217 218
218 219
219 220
220 221
221 222
222 223
223 224
224 225
225 226
226 227
227 228
228 13. More questions posed by monthly fleet operating summary
Page 140
Page 141
Page 142
If you've noticed an error in this article please click here to report it so we can fix it.
NOW that the operating results of a particular 10-ton vehicle have been seen, it must be appreciated that one month's figures for a single vehicle taken in isolation will certainly not provide a standard on which to calculate rates or operating costs for all vehicles of the same capacity.
Each operator's costs are peculiar to himself and, indeed, the only cost ingredient that can be said to be common to all is the excise licence for vehicles of the same unladen weight. For example, motor insurance premiums can vary between one operator and another, depending upon the claims experience and the number of vehicles insured. Furthermore, and particularly in the case of an own-account operator, the insurers may well operate at a loss on the "motor account", simply because they enjoy a large volume of less risky, and therefore more profitable, business from the company in covering such risks as buildings, loss of profits, employers' liability and stock in trade, etc.
Another example already illustrated is in the treatment of depreciation and its impact on profit according to the policy pursued. To this extent therefore the veto that the Prices and Incomes Board placed on the Road Haulage Association's habit of recommending blanket rates increases to its members as the outcome of higher operating costs was justified, always bearing in mind that of the nine cost ingredients explored, eight of them at least will vary between one operator and another.
In order to amplify the disparity that occurs between the operating performance and costs of individual vehicles of the same type and the effect on profitability, I shall refer to our six vehicle/trailer fleet which includes the operating results of the 10-ton rigid vehicle KLM 321C examined in detail earlier on.
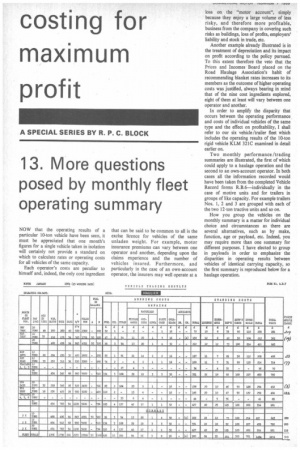
Two monthly performance /trading summaries are illustrated, the first of which could apply to a haulage operation and the second to an own-account operator. In both cases all the information recorded would have been taken from the completed Vehicle Record forms R.B.6—individually in the case of motive units and for trailers in groups of like capacity. For example trailers Nos. I, 2 and 3 are grouped with each of the two 12-ton tractive units and so on.
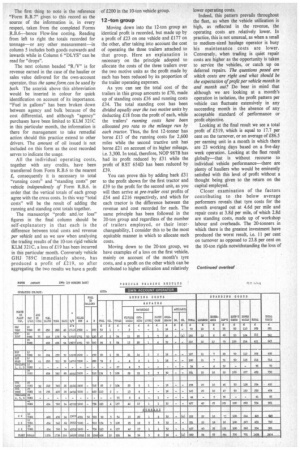
How you group the vehicles on the monthly summary is a matter for individual choice and circumstances as there are several alternatives, such as by make, function, age or payload, etc. Indeed, you may require more than one summary for different purposes. I have elected to group in payloads in order to emphasize the disparities in operating results between vehicles of identical carrying capacity, so the first summary is reproduced below for a haulage operation. The first thing to note is the reference "Form R.B.7" given to this record as the source of the information is, in every respect, taken from the completed Forms R.B.6—hence Flow-line costing. Reading from left to right the totals recorded for tonnage—or any other measurement—in column 5 includes both goods outwards and inwards while in Column 6 "DLYS" can be read for "drops".
The next column headed "1./V" is for revenue earned in the case of the haulier or sales value delivered for the own-account operator, thus the same form. can be used by both. The asterisk above this abbreviation would be inserted in colour for quick identification on account of its importance. "Fuel in gallons" has been broken down between agency and bulk because of the cost differential, and although "agency" purchases have been limited to KLM 32IC in this particular month, the information is there for management to take remedial action should this practice extend to other drivers. The amount of oil issued is not included on this form as the cost recorded serves to indicate the usage.
All the individual operating costs, together with any credits, have been transferred from Form R.B.6 to the nearest 1, consequently it is necessary to total "running costs" and "standing costs" per vehicle independently of Form R.B.6. in order that the vertical totals of each group agree with the cross costs. In this way "total costs" will be the result of adding the running and standing cost totals together.
The manuscript "profit and /or loss" figures in the final column should be self-explanatory in that each is the difference between total costs and revenue per vehicle and as we saw when analysing the trading results of the 10-ton rigid vehicle KLM 321C, a loss of £19 has been incurred in this particular month. Conversely vehicle GHJ 789C immediately above, has produced a profit of £219, so after aggregating the two results we have a profit of £200 in the 10-ton vehicle group. 12-ton group Moving down into the 12-ton group an identical profit is recorded, but made up by a profit of £23 on one vehicle and £177 on the other, after taking into account the cost of operating the three trailers attached to that group. Here an explanation is necessary on the principle adopted to allocate the costs of the three trailers over the two motive units as the profit made by each has been reduced by its proportion of the trailer operating expenses.
As you can see the total cost of the trailers in this group amounts to £70, made up of standing costs £36 and running costs £34. The total standing cost has been divided equally over the two motive units by deducting £18 from the profit of each, while the trailers' running costs have been allocated pro rata to the mileage run by each tractor. Thus, the first 12-tonner has borne £13 of the running costs for 2,600 miles while the second tractive unit has borne £21 on account of its higher mileage, i.e. 3,300. In total, therefore, NOP 987B has had its profit reduced by £31 while the profit of RST 654D has been reduced by £39.
You can prove this by adding back /31 to the profit shown for the first tractor and £39 to the profit for the second unit, as you will then arrive at pre-trailer cost profits of 154 and £216 respectively, and which for each tractor is the difference between the revenue and cost recorded for each. The same principle has been followed in the 20-ton group and regardless of the number of trailers employed, or their interchangeability, I consider this to be the most equitable manner in which to allocate such costs.
Moving down to the 20-ton group, we have examples of a loss on the first vehicle, mainly on account of the month's tyre costs, and a profit on the other which can be attributed to higher utilization and relatively lower operating costs.
Indeed, this pattern prevails throughout the fleet, as when the vehicle utilization is high, as reflected in the revenue, the operating costs are relatively lower. In practice, this is not unusual, as when a small to medium-sized haulage operator is busy his maintenance costs are lower. Conversely, when trading is quiet repair costs are higher as the opportunity is taken to service the vehicles, or catch up on deferred repairs. The questions posed are which costs are right and what should be the expectation of profit per vehicle month in and month out? Do bear in mind that although we are looking at a 'month's operation in isolation, the profit pattern per vehicle can fluctuate extensively in any succeeding month in the absence of any acceptable standard of performance or profit objective.
Looking at the final result we see a total profit of /519, which is equal to 17.7 per cent on the turnover, or an average of £86.5 per earning unit in a month in which there are 23 working days based on a five-day week operation. Looking at the fleet result globally—that is without recourse to individual vehicle performance—there are plenty of hauliers who would be eminently satisfied with this level of profit without a thought being given to the return on the capital employed.
Closer examination of the factors contributing to the below average performers reveals that tyre costs for the month averaged out at 4.6d per mile and repair costs at 3.8d per mile, of which 2.8d are standing costs, made up of workshop labour and overheads. The 20-tonners in which there is the greatest investment have produced the worst result, i.e. 11 per cent on turnover as opposed to 23.8 per cent on the 10-ton rigids notwithstanding the loss of £19 on one of them. Of the month's total costs, i.e. £2,414, standing costs, including workshop labour and overheads, account for 66.66 per cent. So what will happen to the business if there is a recession in trade?
These are only some of the questions which this particular month's trading pattern poses, and although space does not permit the cost analyst to answer them all immediately, he will be doing so according to their priority. In the meantime the important lesson to be learned is that in the absence of a system of individual vehicle performante/costing, such deficiencies as there are, may never come to light.
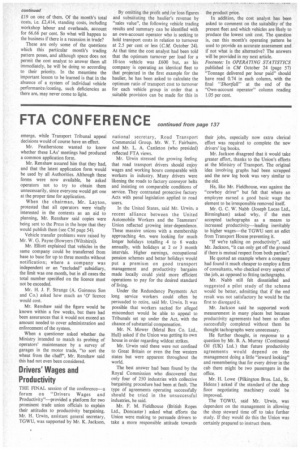
By omitting the profit altd ior loss figures and substituting the haulier's revenue by "sates value", the following vehicle trading results and summary can be identified with an own-account operator who is seeking to hold transport costs in relation to turnover at 2.5 per cent or less (C.M. October 24). At that time the cost analyst had been told that the optimum turnover per load for a 10-ton vehicle was £600 but, as his company is operating an identical fleet to that projected in the first example for the haulier, he has been asked to calculate the optimum ratio of transport cost to turnover for each vehicle group in order that a .suitable provision can be made for this in
the product price.
In addition, the cost analyst has been asked to comment on the suitability of the present fleet and which vehicles are likely to produce the lowest unit cost. The question is, can this month's operating pattern be used to provide an accurate assessment and if not what is the alternative? The answers will be provided in my next article.
Footnote: In OPERATING STATISTICS published in CM October 24 (page 57) "Tonnage delivered per hour paid" should have read 0.74 in each column, with the final "Shortfall" at the end of the "Own-account operator" column reading 1.05 per cent.