 1
1 2
2 3
3 4
4 5
5 6
6 7
7 8
8 9
9 10
10 11
11 12
12 13
13 14
14 15
15 16
16 17
17 18
18 19
19 20
20 21
21 22
22 23
23 24
24 25
25 26
26 27
27 28
28 29
29 30
30 31
31 32
32 33
33 34
34 35
35 36
36 37
37 38
38 39
39 40
40 41
41 42
42 43
43 44
44 45
45 46
46 47
47 48
48 49
49 50
50 51
51 52
52 53
53 54
54 55
55 56
56 57
57 58
58 59
59 60
60 61
61 62
62 63
63 64
64 65
65 66
66 67
67 68
68 69
69 70
70 71
71 72
72 73
73 74
74 75
75 76
76 77
77 78
78 79
79 80
80 81
81 82
82 83
83 84
84 85
85 86
86 87
87 88
88 89
89 90
90 91
91 92
92 93
93 94
94 95
95 96
96 97
97 98
98 99
99 100
100 101
101 102
102 103
103 104
104 105
105 106
106 107
107 108
108 109
109 110
110 111
111 112
112 113
113 114
114 115
115 116
116 117
117 118
118 119
119 120
120 121
121 122
122 123
123 124
124 125
125 126
126 127
127 128
128 129
129 130
130 131
131 132
132 133
133 134
134 135
135 136
136 137
137 138
138 139
139 140
140 141
141 142
142 143
143 144
144 145
145 146
146 147
147 148
148 149
149 150
150 151
151 152
152 153
153 154
154 155
155 156
156 157
157 158
158 159
159 160
160 161
161 162
162 163
163 164
164 165
165 166
166 167
167 168
168 169
169 170
170 171
171 172
172 173
173 174
174 175
175 176
176 177
177 178
178 179
179 180
180 181
181 182
182 183
183 184
184 185
185 186
186 187
187 188
188 189
189 190
190 191
191 192
192 193
193 194
194 195
195 196
196 197
197 198
198 199
199 200
200 201
201 202
202 203
203 204
204 205
205 206
206 207
207 208
208 209
209 210
210 211
211 212
212 213
213 214
214 215
215 216
216 217
217 218
218 219
219 220
220 221
221 222
222 223
223 224
224 225
225 226
226 227
227 228
228 229
229 230
230 231
231 232
232 233
233 234
234 235
235 236
236 237
237 238
238 239
239 240
240 241
241 242
242 243
243 244
244 245
245 246
246 247
247 248
248 249
249 250
250 251
251 252
252 253
253 254
254 255
255 256
256 257
257 258
258 259
259 260
260 The Position of THE ROAD -TRANSPORT INDUSTRY
Page 119
Page 120
If you've noticed an error in this article please click here to report it so we can fix it.
The Business of Carrying Goods and Passengers has Assumed Huge Proportions and the Figures that are Given in this Article Portray an Excellent Picture of its Past and Present Status.
LONG association with statistics concerning the road-transport industry has made us painfully aware of the difficulty of being really informative with bare figures, but we are still more acutely conscious of the difficulty of giving. concise information without them] Our problem, however, lies not so much in a lack of figures, as in our knowledge of their shortcomings.
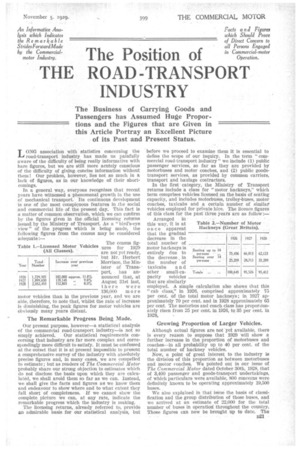
In a general way, everyone recognizes that recent years have 'witnessed a phenomenal growth in the use of mechanical transport. Its continuous development • is one of the most conspicuous features in the social and commercial life of the present day. This fact is a matter of common. observation, which we can confirm by the figures given in the official licensing returns issued. by the Ministry of Transport. As a " bird's-eye \ view" of the progress which• is being made, the following figures from the census may be considered adequate:— The census figures for 1929 are not yet ready, but Mr. Herbert Morrison, the Min ister of Trans port,.. has an nounced that, at August 31st last, there were 136,000 more motor vehicles than in the previous year, and we are able, therefore, to note that, whilst the rate of increase is diminishing, the peak figures for motor vehicles are obviouSly many years distant.
The Remarkable Progress Being Made.
Our preseut purpose, however—a statistical analysis of the commercial road-transport industry—is not so
simply achieved. Our statistical requirements concerning that industry are far more complex and correspondingly more difficult to satisfy. It must be confessed at the outset that it is at present impossible to present a comprehensive survey of the industry with absolutely precise figures and, in many cases, we are compelled to estimate ; but as readers of The Commercial Motor probably share our strong objection to estimates which do not disclose the basis upon which they are calculated, we shall avoid them so far as we can. Instead, we shall give the facts and figures aS we know them and endeavour to show where and to what extent they fall short of completeness. • If we cannot show the complete _picture we can, at any rate, indicate the remarkable progress which the industry is making.
The licensing returns, already referred to, provide an admirable basis for our statistical analysis, but before we proceed to examine them it is essential to define the scope of our inquiry. In the term " commercial road-transport industry" we include (1) public passenger services, so far as they are provided by motorbuses and motor coaches, and (2) public goodstransport services, as provided by common carriers, transport and haulage contractors.
In the first category, the Ministry of Transport returns include a class for " motor hackneys," which term comprises vehicles licensed on the basis of seating capacity, and includes motorbuses, trolley-buses, motor coaches, taxicabs and a certain number, of similaio vehicles employed for 'private hire. The licende figures of this class for the past tliree Years are as follow :-
Arranged in this way, 'ft is at once apparent that the gradual decrease in the total number of motor hackneys is entirely due to the decrease , in the number of
taxicabs and other • small-ca pacity vehicles that are similarly employed. A " cab class," in simple calculation also shows that this 1926, comprised approximately 75 per cent. oil the total motor hackneys; in 1027 approximately 70 per cent, and in 1928 approximately 65 per cent. The motorbus and coach class has proportionately risen from 25 per cent. in 1926, to 35 per cent. in 1928_ employed. A " cab class," in
Growing Proportion of Larger Vehicles.
Although actual figures are not 'yet available, there is every reason to suppose that 1929 will show a further increase in the proportion of motorbuses and coaches—in all probability up to 40 per cent, of the total number of hackney vehicles.
Now, a point of great interest to the industry is the clivisica of this proportion as between motorbuses and motor coaches. We pointed out in our issue of The Commercial Motor dated October 30th, 1928, that of 3,400 passenger and goods-transport undertakings, of which particulars were available, 800 concerns were definitely known to be operating approximately 19,500 buses.
We also explained in that issue the basis of classification and the group distribution of those buses, and we arrived at an estimate of 22,000 for the total number of buses in operation/ throughout the country. Those figures can now be brought up to date. The D21
total number of passenger and goods-transport undertakings recorded is 3,623, of which 1,425 concerns are known to be operating 36,503 vehicles, including 22,768 buses. These buses are in the hands of 627 operators.
In passing, it may be noted that the reduction in the number of bus-operating concerns is accounted for by group amalgamations and the consequent elimination of some of the smaller proprietors-one of the present-day economic features of passenger transport to which we have previously called attention.
Based on the facts elicited from the above calculations, the aggregate number of buses in operation throughout the country is now estimated to be 23,500, or approximately 25 per cent. of the total number of hackney vehicles licensed. On the same basis of calculation, therefore, we may assume that the total number of motor coaches used for purposes of public and private hire approximates to 9,500. The following table sums up in simple fashion the present position and recent progress : TABLE 3.
Motor Hackneys : Relative Proportions for Various The position in the goods-transport section of the industry is more obscure, and under present conditions it seems improbable that we shall be able reliably to fix the proportions of public and private goods-transport haulage.
Traders and Hauliers Traffic.
The Commercial Motor Users' Association has estimated that 80 per cent. of road-borne goods are carried in the traders' own vehicles and 20 per cent, in vehicles owned by public hauliers. Upon what basis the estimate has been arrived at we do not know, but it is unquestionably a fact that an overwhelming proportion of goods traffic is handled directly by the trader.
In the light of this estimate, we may consider the following table, showing the total number of goods vehicles licensed in 1926, 1927 and 1928: The enormous development of road transport is
1926 1927 Ins as conspicuous in this field as in the public passenger section, but to subdivide these totals into public and private trans3,238 port is, as we have already in
Totals .. 257,123 282,905 305,744
dicated, an im
possibility. Some attempt to cover the ground has been made, and particulars of rolling stock have been obtained from approximately 500 operators, showing a total of 9,000 lorries, etc., in service. This is but a part of what may be termed the organized section of the industry, but in a far greater degree than in the passenger section, the public transport of goods is a one-man business. To attempt, in the face of all these difficulties, to present a picture of the road
* Not separately specified.
transport industry as a whole may appear to be a somewhat futile procedure, but, if we cannot show its whole extent, we can, at any rate, show the extent which it exceeds, and that in itself is valuable as an indication of progress and as a basis for estimates.
The first systematic attempt to chronicle the industry was made in 1914-15 and the records that were obtained furnished particulars of 331 undertakings, mainly concerned with passenger transport. By 1920, the records had grown to 800 concerns. Five years later the number of transport undertakings that were indicated had risen to over 3,200. To-day, the records contain particulars of 3,626 road-transport concerns, of which 2,014 are limited companies, 1,485 private firms and individuals, and 127 municipalities.
Many New Undertakings.
The progress thus revealed is a real progress, in the sense that the increases in the number of undertakings recorded represent, for the greater part, additions of new undertakings. As a reading of the total number of mechanical-transport concerns in the country, however, where does the figure or 3,626 fall short? The answer to this question is mainly in the number of private firms and individuals recorded. We can keep a fairly close check on the limited companies
and the municipalities. They are subject to legal registration in one form or another. The private firm and individual are under no such control.
The inclusion in the activities of the industry of a large body of unincorporated concerns is a factor which also operates against the possibility of making any exact estimate of the total capital invested in the trade. Here again, however, the actual figures that we have obtained are highly important from the propress point of view.
The Amount of Capital Invested.
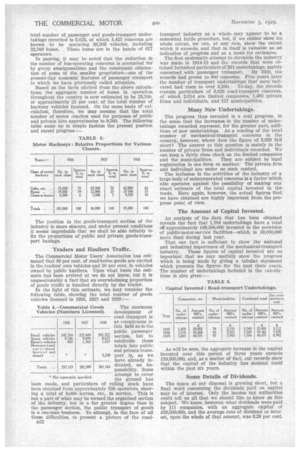
An analysis of the data that has been obtained reveals the fact that 1,704 undertakings have a total of approximately £48,500,000 invested in the provision of public-motor-service facilities-which is 19,000,000 more than during last year.
That one fact is sufficient to show the national and industrial importance of the mechanical-transport industry. These figures of capital invested are so important that we may usefully show the progress which is being made by giving a tabular statement which presents the figures for the past three years. The number of undertakings included in the calculations is also given :
TABLE 5.
Capital Invested : Road-transport Undertakings.
As will be seen, the aggregate increase in the capital invested over this period of three years exceeds £19,500,000, and, as a matter of fact, our records show that the capital of the industry has doubled itself within the past six years.
Some Details of Dividends.
The space at our disposal is growing short, but a final word concerning the dividends paid on capital may be of interest. Only the income tax authorities could tell us all that we should like to know on this subject. We know, however, what dividends were paid by 111 companies, with an aggregate capital of 00,500,000, and the average rate of dividend or inter est, upon the whole of that amount, was 6.29 per cent.