 1
1 2
2 3
3 4
4 5
5 6
6 7
7 8
8 9
9 10
10 11
11 12
12 13
13 14
14 15
15 16
16 17
17 18
18 19
19 20
20 21
21 22
22 23
23 24
24 25
25 26
26 27
27 28
28 29
29 30
30 31
31 32
32 33
33 34
34 35
35 36
36 37
37 38
38 39
39 40
40 41
41 42
42 43
43 44
44 45
45 46
46 47
47 48
48 49
49 50
50 51
51 52
52 53
53 54
54 55
55 56
56 57
57 58
58 59
59 60
60 61
61 62
62 63
63 64
64 65
65 66
66 67
67 68
68 69
69 70
70 71
71 72
72 73
73 74
74 75
75 76
76 77
77 78
78 79
79 80
80 81
81 82
82 83
83 84
84 85
85 86
86 87
87 88
88 89
89 90
90 91
91 92
92 93
93 94
94 95
95 96
96 97
97 98
98 99
99 100
100 101
101 102
102 103
103 104
104 105
105 106
106 107
107 108
108 109
109 110
110 111
111 112
112 113
113 114
114 115
115 116
116 117
117 118
118 119
119 120
120 121
121 122
122 123
123 124
124 125
125 126
126 127
127 128
128 129
129 130
130 131
131 132
132 133
133 134
134 135
135 136
136 THE COMMON ROOM by George Wilmot
Page 86
If you've noticed an error in this article please click here to report it so we can fix it.
Road goods vehicles in GB: vital statistics
AS WITH the road passenger industry, it is essential in studying road haulage to start with a firm basis of a few really relevant statistics. Although the information on road haulage is less extensive than it is for road passengers, it still comes to a great mass of data.
The main source is the Ministry of Transport's annual Highway Statistics which is bolstered by much additional information as a result of the Survey of Road Goods Transport, 1962 with final results published (parts I and II) in 1964 and a final report in 1966.
The chief problem facing the student in trying to digest these figures is that it is so easy—as with so many statistics—to gain wrong impressions and jump to false conclusions.
The total number of road goods vehicles licensed in 1965 was: But, although C licensed vehicles constitute over 85 per cent of all vehicles, they perform slightly less than 50 per cent of the ton-mileage operated by all goods vehicles in Great Britain. The reason is, of course, that own-use vehicles are usually comparatively small in capacity and are used for local runs at rather low utilization rates.
The public haulage figures need a little closer examination. The 217,000 vehicles are distributed in fleets as follows: Public haulage goods vehicles are run by over 45,000 operators, of whom one-half have only one vehicle and 85 per cent have no more than five. The structure of own-account haulage is similar with a huge total of the vehicles operated by small fleet owners.
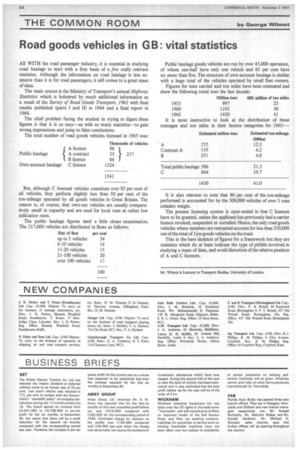
Figures for tons carried and ton miles have been estimated and show the following trend over the last decade:
Million tons 000 million of ton miles
1955 997 23 1960 1192 30 1965 1430 41 It is most instructive to look at the distribution of these tonnages and ton miles in their licence categories for 1965: Estimated million tons Estimated ton mileage It is also relevant to note that 80 per cent of the ton-mileage performed is accounted for by the 300,000 vehicles of over 3 tons unladen weight.
The present licensing system is open-ended in that C licences have to be granted, unless the applicant has previously had a carrier licence revoked, suspended or curtailed. Hence, the only road goods vehicles where numbers are restrained account for less than 250,000 out of the total of lfrn goods vehicles on the road.
This is the bare skeleton of figures for a framework but they are statistics which do at least indicate the type of pitfalls involved in studying a mass of data, and avoid distortion of the relative position of A and C licences.