


Scania simulates the problems and solutions
Page 38
Page 39
Page 40
Page 41
Page 46
If you've noticed an error in this article please click here to report it so we can fix it.
Scania's Dr Sjostrom who presented a paper on the national use of energy at the 1978 conference returned tnis year to explain Scania's approach for the 1980s
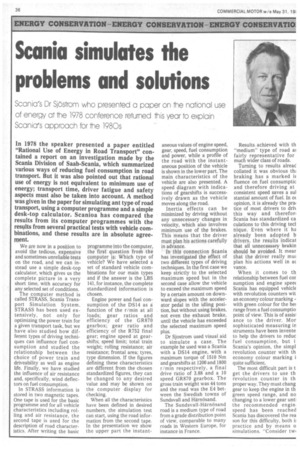
We are now in a position to avoid the tedious, expensive and sometimes unreliable tests on the road, and we can instead use a simple desk-top calculator, which gives us the complete picture in a very short time, with accuracy for any selected set of conditions.
The computer method is called STRASS, Scania Transport Simulation System. STRASS has been used extensively, not only for optimizing the power train for a given transport task, but we have also studied how different types of driving techniques can influence fuel consumption and studied the relationship between the choice of power train and driveability as well as engine life. Finally, we have studied the influence of air resistance and, specifically, wind deflectors on fuel consumption.
In STRASS information is stored in two magnetic tapes. One tape is used for the basic programme and for all vehicle characteristics including rolling and air resistance, the second tape is used for the description of road characteristics. After writing the basic programme into the computer, the first question from the computer is: Which type of vehicle? We have selected a set of standard vehicle combinations for our main types and if the answer is the LBS 141, for instance, the complete standardized information is chosen.
Engine power and fuel consumption of the DS14 as a function of the r/min at all loads; gear ratios and efficiency of the GR870 gearbox; gear ratio and efficiency of the R752 final gear; engine speed at gearshifts; speed limit; total train weight; rolling resistance; air resistance; frontal area; tyres, type dimension. If the figures defining these characteristics are different from the chosen standardized figures, they can be changed to any desired value and may be shown on the computer display for checking.
When all the characteristics have been defined in desired numbers, the simulation test can start, using the road information from the second tape. In the presentation we show the upper part the instant aneous values of engine speed, gear, speed, fuel consumption and power, while a profile of the road with the instantaneous position of the vehicle is shown in the lower part. The main characteristics of the vehicle are also presented. A speed diagram with indications of gearshifts is successively drawn as the vehicle moves along the road.
Inertia effects can be minimized by driving without any unnecessary changes in velocity, which also involves minimum use of the brakes. This means that the driver must plan his actions carefully in advance.
In this connection Scania has investigated the effect of two different types of driving techniques. In the first case we keep strictly to the selected maximum speed but in the second case allow the vehicle to exceed the maximum speed by a certain amount on downward slopes with the accelerator pedal in the idling position, but without using brakes, not even the exhaust brake, until the vehicle has exceeded the selected maximum speed plus. Dr Sjostrom used visual aid to simulate a case. The example he used was a Scania with a DS14 engine, with a maximum torque of 1510 Nm and gearshifts at 1200 and 1800 r /min respectively, a final drive ratio of 3.88 and a 10 speed GR870 gearbox. The gross train weight was 44 tons and the road was the E4 between the Swedish towns of Sundsvall and Harnasand.
The Sundsvall-HarnOsand road is a medium type of road from a grade distribution point of view, comparable to many roads in Western Europe, for instance in France. Results, achieved with th "medium" type of road ai fairly representative for much wider class of roads.
Turning to results alread collated it was obvious thn braking has a marked it fluence on fuel consumptic and therefore driving at consistent speed saves a sul stantial amount of fuel. In ot opinion, it is already the pra■ tice of most drivers to driN this way and therefor' Scania has standardized ca culations to this driving tecl nique. Even where it ha already been adopted b drivers, the results indicat that all unnecessary brakin should be avoided. It mear that the driver really mw plan his actions well in at vance.
When it comes to th relationship between fuel cor sumption and engine spee( Scania has equipped vehicle with revolution counters wit an economy colour marking with green colour for the be range from a fuel con sumptio point of view. This is of assisi mice to the driver. M or sophisticated measuring in struments have been invente to help the drivers to reduc fuel consumption, but i Scania's opinion, the simpl revolution counter with th economy colour marking i quite sufficient.
The most difficult part is t get the drivers to use th revolution counter in th proper way. They must chang gear to keep the engine in th green speed range, and no changing to a lower gear unti the recommended engin, speed has been reached Scania has discovered the rea son for this difficulty, both ii practice and by means o simulations. "Consider twq ehicle combination s with the ame total train weight, but ne is equipped with a more owerful engine than the ther," he said.
The example is of two canias, one with a DS14 enme, a maximum torque of 510 Nm, gearshifts at 1200 nd 1800 r/min respectively, a nal drive ratio of 3.88 and a 0-speed GR870 gearbox. The ther has a DS11 engine, a laximum torque of 1130 Nm, earshifts at 1400 and 2000 r/ in respectively, a final drive atio of 4.125 and a 10-speed 1R870 gearbox. The gross rain weight is 44 tons and the oad is the Sundsvalllarntisand road.
If the combination, equiped with the less powerful )S11 engine, tries to catch up vith the truck combination vith the DS14 engine the [river will require to change ;ear at higher engine speeds to lo so. "We have assumed ;earshifts at 2200 and 1700 r/ nin in our calculations and the .esults show a substantial inTease in fuel consumption, vhen compared at the same iverage speed," he said.
This proves that when a less )owerful vehicle tries to folow a more powerful vehicle, he result will be a higher fuel ;onsumption for the less )owerful truck.
To summarise the results with truck combinations, when using the Scania DS14 and DS11 engines in the -ecommended way, the fuel .7.onsumption versus the iverage speed for three dif'erent gross train weights. The -oad is again the Sundsvall to HdrnOsand road. The relationship discussed for 44 ton train weights are substantially the same as for 32 and 38 ton trains.
Driveability is an undefined characteristic but in spite of this it is very important. Drivers talk about tardy vehicles, when engine power is too small or when final drive ratio is too fast. Then it would be natural to think about the acceleration time as a criterion for driveabilitv, but tests have shown that the acceleration time is almost unaffected by changes in the final drive ratio, whereas drivers can experience such changes very, markedly.
Through discussions with experienced drivers, Scania have come to the conclusion that a good criterion for driveability is the total number of gearshifts that the driver has to perform in a measured distance.
The experience we have gained, comparing all our theoretical results with practical experience is that when optimizing the power train for a certain transport task, it is necessary to make a compromise between fuel consump tion and driveability. Generally the final drive ratio for best fuel consumption is too fast for good driveability.
When calculating transport costs, further factors come into the picture, of course, and one of the most important factors is the transport time.
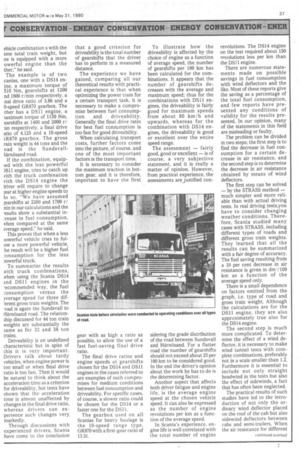
It is necessary to consider the maximum traction in bottom gear, and it is therefore, important to have the first gear with as high a ratio as possible, to allow the use of a fast fuel-saving final drive ratio.
The final drive ratios and engine speeds at gearshifts chosen for the DS14 and DS11 engines in the cases referred to are examples of such compromises for medium conditions between fuel consumption and driveability. For specific cases, of course, a slower ratio could be chosen for the DS14 or a faster one for the DS11.
The gearbox used on all Scanias for heavy haulage is the 10-speed range type, GR870 with a first-gear ratio of 13.51. To illustrate how the driveability is affected by the choice of engine as a function of average speed, the number of gearshifts per 100 km has been calculated for the combinations. It appears that the number of gearshifts decreases with the average and maximum speed; thus for the combinations with DS11 engines, the driveability is fairly good for maximum speeds from about 80 km/h and upwards, whereas for the combination with DS14 engines, the driveability is good or excellent over the entire speed range.
The assessment — fairly good, good or excellent — is of course, a very subjective statement, and it is really a matter of opinion. However, from practical experience, the assessments are justified con sidering the grade distribution of the road between Sundsvall and H6rntisand. For a flatter road the number of gearshifts should not exceed about 25 per 100 km to be considered good. In the end the driver's opinion about the work he has to do is the determining factor.
Another aspect that affects both driver fatigue and engine life, is the average engine speed at the chosen vehicle speed. It can also be expressed as the number of engine revolutions per km as a function of the average speed.
In Scania's experience, engine life is well correlated with the total number of engine revolutions. The DS14 engine on the test required about 150 revolutions less per km than the DS11 engine.
There are numerous statements made on possible savings in fuel consumption with wind deflectors and the like. Most of these reports give the saving as a percentage of the total fuel consumption, and few reports have presented any conditions of validity for the results presented. In our opinion, many of the statements in this field are misleading or faulty.
The problem can be divided in two steps; the first step is to find the decrease in fuel consumption for a certain decrease in air resistance, and the second step is to determine the decrease in air resistance obtained by means of wind deflectors.
The first step can be solved — by the STRASS method — much simpler and more reliable than with actual driving tests. In real driving tests,you have to consider changing weather conditions. Therefore, Scania studied many cases with STRASS, including different types of roads and different gross train weights. They learned that all the results can be summarized with a fair degree of accuracy. The fuel saving resulting from a 10 per cent decrease in air resistance is given in din'/100 km as a function of the average speed only.
There is a small dependence on factors omitted from the graph, i.e. type of road and gross train weight. Although the calculations are for the DS11 engine, they are also approximately true also for the DS14 engine.
The second step is much more complicated. To deter mine the effect of a wind de flector, it is necessary to make wind tunnel tests with com plete combinations, preferably not in a scale smaller than 1.2. Furthermore it is essential to include not only straight headwind in the tests but also the effect of sidewinds, a fact that has often been neglected.
The practical results of such studies have led to the intro duction of not only the or dinary wind deflector placed on the roof of the cab but also sidewind deflectors between cabs and semi-trailers. When the air resistance for different angles of attack is known, a statistical analysis, including different wind directions, can be carried out, giving average • air resistance figure.
Scania is now performing an extensive study of the air resistance for complete combinations, including the use of both headwind and sidewihd de flectors. The tests are being made in collaboration with the Aero Space Division of SaabScania and they are using the facilities at MIRA in Nuneaton. These tests will be completed at the end of this year, and since the results will be of general interest, they intend to publish them. information which they circulate. A 22 minute film oriented to owner-operator fuel efficiency and profit, a six minute film on the effects of speed on fuel economy, and a 45 minute audio visual show on the many aspects of CV fuel economy are being circulated on loan to anyone who requests them.
VP publishes 8500 copies of their quarterly Fuel Economy News, a newsletter to some 6500 individuals who have requested it and distributed on a limited basis elsewhere. The trade press members have greatly expanded their reporting on fuel economy via new product reports and articles on motor carrier achievements. VP is particularly pleased with the continuing trade press is doing. He said "I can but surmise that the potential here is just as great as in the United States."
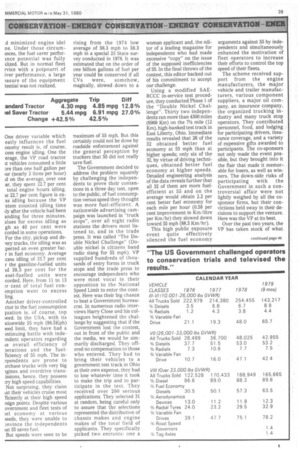
American manufacturers have performed wonders in the many new product offerings, for example: new diesel engines — the third generation in some cases of fuel savers called formula, fuel-squeezer, fuel pincher, economy, or maxidynes have demonstrated improvements in brake specific fuel consumption of ten per cent and more, have reset governors to exclude the inefficient high rpm operating range and have rematched turbochargers to improve low rpm performance. Coupling these improvements with the proper driveline leads to fuel savings of 20 percent in some cases and up to 40 percent in others where built-in speed control can pay off. VPs test fleet of eight ir strumented vehicles has con pleted its time in real world c operations. A total of 200,00 miles of such operations ha been accumulated by the flee plus countless displays a capitols across the USA an gatherings of operators. Thes instrumented vehicles hay accumulated a priceless banl of data revealing true day-to day operating parameters. VI will be able to analyse am reanalyse the data for years t( come. The summary result: are: "standard" tractor trailer: 4.24 mpg, "fuel saver" tracto trailers 5.34 mpg, "standard' rigids 4.96 mpg, "fuel saver' rigids 7.75 mpg.
In this year of operation, th( fuel saver tractors demon strated a 26 per cent improve. ment in fuel economy via theii fuel-efficient engine, (firsi generation), radial tyres, far drive, and roof-mountec aerodynamic devices. The fuel saver pickup and delivery vehicles demonstrated a 56 pet cent improvement in fuel economy when the diesel engine replaced the standard petrol engine, fan drive, radial tyres, and body-mounted aerodynamic devices.
Some immediate comparisons of data sets can be made; such as the improvement offered by a fuel saver in regular service versus results of single trips by test drivers to display the vehicles. One such comparison by the White road tractors resulted in these figures.
On a controlled trip, in this case 391 miles (629 km) from Cleveland, Ohio to Washington, D.C., the fuel saving devices produced a 42 per cent improvement in fuel economy, while in routine service only 26 per cent was realized. The cursory explanation of these differences is that on the trip, the fuel saver tractor was paired with a streamlined trailer on radial tyres, while the standard tractor pulled an exterior post-trailer with bias ply tyres. In fleet service each tractfq„ Twas used indis crimmantly to' pull the .whole array of company trailers. This difference could account for, perhaps, four to eight per cent of the difference. The big difference lies with the drivers. The test drivers kept their operations smooth throughout the trip, strictly observed the national maximum speed limit of 55 mph (88.5Km/hr) d minimized engine idel ne. Under those circuminces, the fuel saver perforance potential was fully alized. But in normal fleet rvice with a potpourri of iver performance, a large ?asure of the equipment tential was not realized. rising from the 1974 low average of 56.3 mph to 58.3 mph in a special 25 State survey conducted in 1978. It was estimated that on the order of one billion gallons of fuel per year could be conserved if all CVs were, somehow, magically, slowed down to a One driver variable which eatly influences the fuel onomy result is, of course, cess engine idling. One the -erage, the VP road tractor it vehicles consumed a little 3re than one half gallon per lur (nearly 2 litres per hour) id on the average, over one .ar, they spent 22.7 per cent total engine hours idling. le 22.7 per cent figure is ex'ss idling because the VP stem counted idling time ily after the vehicle had been anding for three minutes. alues for excess idling as gh as 40 per cent were corded in some operations. For the city, pickup and deTry trucks, the idling was as :pected an even greater facr in fuel economy. Average :cess idling of 33.7 per cent r the gasoline-fuelled units Id 38.5 per cent for the esel-fuelled units were corded. Here, from 11 to 13 ?r cent of total fuel conimption went to excess ling.
Another driver-controlled ctor in the fuel consumption ivation is, of course, top )eed. In the USA, with its ationwide 55 mph (88.5Kph) )eed limit, they have had a mtinuing battle with indemdent operators regarding le overall efficiency of perations and the fuelficiency of 55 mph. The in?pendents are prone to archase trucks with very big lgines and overdrive trans.issions, hence, they possess ?ry high speed capabilities. Not surprising, they claim iat their vehicles cruise most ficiently at their high speed ?sign points. Despite various overnment and fleet tests of lel economy at various )eeds, they were unable to mvince the independents at 55 saves fuel.
But speeds were seen to be maximum of 55 mph. But this certainly could not be done by roadside enforcement against the general perception by truckers that 55 did not really save fuel.
The Government decided to address the problem squarely by challenging the independents to prove their contentions in a three day test, open to the public, of fuel consumption versus speed they thought was more fuel-efficient. A nationwide advertising campaign was launched in "truck stops", over all night radio stations the drivers most listened to, and in the trade press. It was called "The Double Nickel Challenge" (Double nickel is citizens band radio slang for 55 mph). VP supplied hundreds of thousands of entry forms in truck stops and the trade press to encourage independents who were most vocal in their opposition to the National Speed Limit to enter the contest. Here was their big chance to beat a Government bureaucrat. In numerous radio interviews Harry Close and his colleagues heightened the challenge by suggesting that if the Government lost the contest, out in front of the public and the media, we would be simmarily discharged. They offered no compensation to those who entered. They had to bring their vehicles to a government test track in Ohio at their own expense, they had to lose whatever time it took to make the trip and to participate in the test. They received over '200 serious applications. They selected 31 at random, being careful only to assure that the selections represented the distribution of chassis makes and engine makes of the total field of applicants. They specifically picked two entrants: one a woman applicant and, the editor of a leading magazine for independents who had made excessive "copy" on the issue of the supposed inefficiencies of 55. In the final throws of the contest, this editor backed out of his commitment to accept our challenge.
Using a modified SAERCCC in-service test procedure, they conducted Phase 1 of the "Double Nickel Challenge". Thirty two independents ran more than 4300 miles (6900 Kin) on the 71/2 mile (12 Km), high-banked test track in East Liberty, Ohio. Immediate results revealed that 26 of the 32 obtained better fuel economy at 55 mph than at higher speeds; only six of the 32, by virtue of driving techniques, obtained better fuel economy at higher speeds. Detailed engineering analysis of the data reveals further that all 32 of them are more fuelefficient at 55 and on the average would obtain 2.2 per cent better fuel economy for each mile per hour (0.58 per cent improvement in Km/litre per Km/hr) they slowed down toward 55 mph (88.5 Km/hr).
This high public exposure event quite effectively silenced the fuel economy arguments against 55 by independents and simultaneously enhanced the motivation of fleet operators to increase their efforts to control the top speed of their fleets.
The scheme received support from the engine manufacturers, the major vehicle and trailer manufacturers, various component suppliers, a major oil company, an insurance company, the organized trucking industry and many truck stop operators. They contributed personnel, food, and lodging for participating drivers, insurance coverage, and a variety of expensive gifts awarded to participants. The co-sponsors not only made the event possible, but they brought into it the flair that made it memorable for losers, as well as winners. The down-side risks of participating with the Government in such a controversial affair were not lightly weighed by all the cosponsor firms, but their convictions held sway in their decisions to support the venture. Here was the VP at its best.
Over the past two years, the VP has taken stock of what new vehicle equipment changes have been made to improve fuel economy. Through the Motor Vehicle Manufacturers Association of the US, all major vehicle manufacturers have searched back through their sales record of options identified as fuel savers and have reported all pertinent statistics. Further, the manufacturers are, on a continuing basis, providing VP with quarterly reports of the factory sales of these options. Included in these reports are: diesel engines (vs. petrol); fuel-efficient diesels; fan drives; aerodynamic devices; radial tyres; road speed governors; and tag axles.
This is a summary of these statistics, through the first nine months of 1979.
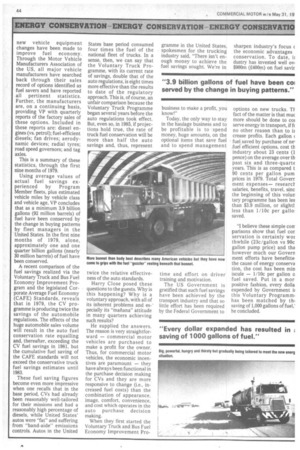
Using average values of actual fuel savings experienced by Program Member fleets, plus estimated vehicle miles by vehicle class and vehicle age, VP concludes that as a minimum 3.9 billion gallons (92 million barrels) of fuel have been conserved by the change in buying patterns by fleet managers in the United States. In the first nine months of 1979, alone, approximately one and one quarter billion gallons (nearly 30 million barrels) of fuel have been conserved.
A recent comparison of the fuel savings realized via the Voluntary Truck and Bus Fuel Economy Improvement Program and the legislated Corporate Average Fuel Economy (CAFE) Standards, reveals that in 1979, the CV programme is producing twice the savings of the automobile regulations. The effects of the huge automobile sales volume will result in the auto fuel conservation rate equalling and, thereafter, exceeding the CV fuel savings in 1981, but the cumulative fuel saving of the CAFE standards will not exceed the conservative truck fuel savings estimates until 1983.
These fuel saving figures become even more impressive when one recalls that in the base period, CVs had already been reasonably well-tailored for their missions and had a reasonably high percentage of diesels, while United States' autos were "fat" and suffering from "band-aide" emissions controls. Autos in the United States base period consumed four times the fuel of the national fleet of trucks. In a sense, then, we can say that the Voluntary Truck Programme, with its current rate of savings, double that of the auto regulations, is eight times more effective than the results to date of the regulatory approach. This is, of course, an unfair comparison because the Voluntary Truck Programme began several years before the auto regulations took effect. But, even so, in 1985, if projections hold true, the rate of truck fuel conservation will be more than half the auto savings and, thus, represent twice the relative effectiveness of the auto standards.
Harry Close posed these questions to the guests. Why is this happening? Why is a voluntary approach, with all of its inherent problems and es' pecially its "mafiana" attitude in many quarters achieving such results?
He supplied the answers. The reason is very straightforward — commercial motor vehicles are purchased to make a profit for the owner. Thus, for commercial motor vehicles, the economic incentives are paramount — they have always been functional in the purchase decision making for CVs and they are more responsive to change (i.e., increased fuel costs) than the combination of appearance, image. comfort, convenience, and cost which operates in the auto purchase decision making.
When they first started the Voluntary Truck and Bus Fuel Economy Improvement Pro gramme in the United States, spokesmen for the trucking industry said, "There isn't enough money to achieve the fuel savings sought. We're in business to make a profit, you know!"
Today, the only way to stay in the haulage business and to be profitable is to spend money, huge amounts, on the optional items that save fuel and to spend management time and effort on driver training and motivation.
The US Government is gratified that such fuel savings have been achieved by the transport industry and that so little effort has been required by the Federal Government to sharpen industry's focus the economic advantages conservation. To date, ii dustry has invested well ov. $900m (E400m) on fuel savir options on new trucks. TI fact of the matter is that mut more should be done to co] serve energy in transport, if ft no other reason than to it crease profits. Each gallon ( fuel, saved by purchase of ne' luel efficient options, cost th industry about 23 cents (1 pence) on the average over th past six and three-quartE years. This is as compared t 90 cents per gallon pum prices in 1979. Total Goverr ment expenses— researcf salaries, benefits, travel, sinc the beginning of this volur tary programme has been les than $3.9 million, or slightl less than 1/10c per gall°. saved.
"I believe these simple con parisons show that fuel cor servation is certainly wor thwhile (23c /gallon vs 90c gallon pump price) and tha however much our Govern ment efforts have benefitte the cause of energy conserva tion, the cost has been min iscule — 1/10c per gallon o fuel saved. Put in a mor positive fashion, every dolla expended by Government ii this Voluntary Programmi has been matched by till saving of 1,000 gallons of fuel,' he concluded.