 1
1 2
2 3
3 4
4 5
5 6
6 7
7 8
8 9
9 10
10 11
11 12
12 13
13 14
14 15
15 16
16 17
17 18
18 19
19 20
20 21
21 22
22 23
23 24
24 25
25 26
26 27
27 28
28 29
29 30
30 31
31 32
32 33
33 34
34 35
35 36
36 37
37 38
38 39
39 40
40 41
41 42
42 43
43 44
44 45
45 46
46 47
47 48
48 49
49 50
50 51
51 52
52 53
53 54
54 55
55 56
56 57
57 58
58 59
59 60
60 61
61 62
62 63
63 64
64 65
65 66
66 67
67 68
68 69
69 70
70 71
71 72
72 73
73 74
74 75
75 76
76 77
77 78
78 79
79 80
80 81
81 82
82 83
83 84
84 85
85 86
86 87
87 88
88 89
89 90
90 91
91 92
92 93
93 94
94 95
95 96
96 97
97 98
98 99
99 100
100 101
101 102
102 103
103 104
104 105
105 106
106 107
107 108
108 109
109 110
110 111
111 112
112 113
113 114
114 115
115 116
116 117
117 118
118 119
119 120
120 121
121 122
122 123
123 124
124 125
125 126
126 127
127 128
128 129
129 130
130 131
131 132
132 133
133 134
134 135
135 136
136 137
137 138
138 139
139 140
140 141
141 142
142 143
143 144
144 145
145 146
146 147
147 148
148 149
149 150
150 151
151 152
152 153
153 154
154 155
155 156
156 157
157 158
158 159
159 160
160 161
161 162
162 163
163 164
164 165
165 166
166 167
167 168
168 169
169 170
170 171
171 172
172 173
173 174
174 175
175 176
176 177
177 178
178 179
179 180
180 181
181 182
182 A year in view
Page 22
If you've noticed an error in this article please click here to report it so we can fix it.
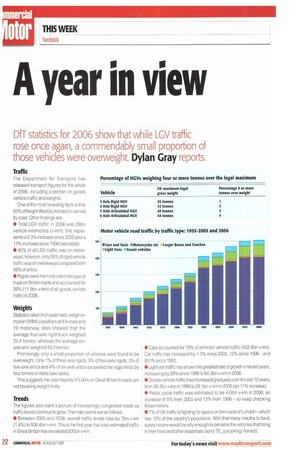
DfT statistics for 2006 show that while LGV traffic rose once again, a commendably small proportion of those vehicles were overweight. Dylan Gray reports.
Traffic
The Department for Transport has released transport figures for the whole of 2006, including a sectjon on goods vehicle traffic and weights.
One of the most revealing facts is that 83% of freight lifted (by tonnes) is carried by road. Other f lndings are: • Total LGV traffic in 2006 was 29bn vehicle-kilometres (v-km); this represents a 0.3% increase since 2005 and a 11% increase since 1996 (see table).
• 40% of all LGV traffic was on motorways; however, only 28% of rigid vehicle traffic was on motorways compared with 56% of art ice.
• Rig ids were the most common type of truck on British roads and accounted for 39% (11.3bn v-km) of all goods vehicle traffic in 2006.
Weights
Statistics taken from automatic weigh-inmotion (WI M) classifiers at 9 A-road and 19 motorway sites showed that the average four-axle rigid truck weighed 22.4 tonnes, whereas the average sixaxle artic weighed 34.2 tonnes.
Promisingly, only a small proportion of vehicles were found to be overweight. Only 1% of three-axle rigids, 3% of four-axle rigids, 3% of five-axle artjcs and 4% of six-axle artics exceeded the legal limits by four tonnes or more (see table).
This suggests the vast majority of LGVs on Great Britain's roads are not breaking weight limits.
Trends
The figures also paint a picture of increasingly congested roads as traffic levels continue to grow. The main points are as follows: • Between 2005 and 2006, overall traffic levels rose by 7bn v-km (1.4%) to 506.4bn v-km. This is the first year that total estimated traffic in Great Britain has exceeded 500bn v-km. • Cars accounted for 79% of all motor vehicle traffic (402.4bn v-km). Car traffic has increased by 1.3% since 2005, 12% since 1996 and 851% since 1955.
• Light van traffic has shown the greatest rate of growth in recent years, increasing by 39% since 1996 to 64.3bn v-km in 2006.
• Goods vehicle traffic has increased gradually over the last 10 years, from 26.2bn v-km in 1996 to 29.1bn v-km in 2006 (an 11% increase).
• Pedal cycle traffic was estimated to be 4.6bn v-km in 2006, an increase of 5% from 2005 and 12% from 1996 so keep checking those mirrors.
• 7% of UK traffic is fighting for space on the roads of London -which has 13% of the country's population. With that many mouths to feed, surely no one would be silly enough to penalise the vehicles that bring in their food and other essentials (sorry TfL; just joking, honest).