


What chart analysis can reveal
Page 38
Page 39
If you've noticed an error in this article please click here to report it so we can fix it.
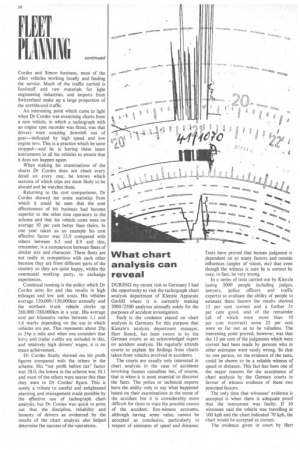
DURING my recent visit to Germany I had the opportunity to visit the tachograph chart analysis department of Kienzle Apparate GmbH where it is currently making 2000/2500 analyses annually solely for the purposes of accident investigation.
Such is the credence placed on chart analysis in Germany for this purpose that Kienzle's analysis department manager, Herr Streck, has been sworn in by the German courts as an acknowledged expert on accident analysis. He regularly attends courts to explain his findings from charts taken from vehicles involved in accidents.
The courts are usually only interested in chart analysis in the case of accidents involving human casualties but, of course, that is when it is most essential to discover the facts. The police or technical experts have the ability only to say what happened based on their examinations at the scene of the accident but it is considerably more difficult for them to state the possible causes of the accident. Eye-witness accounts, although having some value, cannot be accepted as conclusive, particularly in respect of estimates of speed and distance. Tests have proved that human judgment is dependent on so many factors and outside influences (angles of vision, etc) that even though the witness is sure he is correct he may, in fact, be very wrong.
In a series of tests carried out by Kienzle (using 3000 people including judges, lawyers, police officers and traffic experts) to evaluate the ability of people to estimate these factors the results showed 12 per cent correct and a further 21 per cent good, and of the remainder (all of which were more than 10 per cent incorrect) some 25 per cent were so far out as to be valueless. The interesting point proved, however, was that the 12 per cent of the judgments which were correct had been made by persons who in other estimates were vastly wrong. So that no one person, on the evidence of the tests, could be shown to be a reliable witness of speed or distance. This fact has been one of the major reasons for the acceptance of chart analysis by the German courts in favour of witness evidence of these two principal factors.
The only time that witnesses' evidence is accepted is when there is adequate proof that the instrument was faulty. If 10 witnesses said the vehicle was travelling at 100 kph and the chart indicated 70 kph, the chart would be accepted as correct.
The evidence given • in court by Herr Streck only relates to metres and seconds and as such is a neutral opinion based on the graphics of a chart which shows the speed at the point of impact and the quality of the driving immediately before the accident. This latter point is important in establishing a just decision in view of the possibilities of exaggerated estimates by witnesses of a vehicle's speed.
Chart removed At the scene of the accident the police remove the tachograph, chart and it is submitted to Kienzle together with a report stating the date, time and place of the accident, the vehicle type and whether a trailer was attached, the total weight, the type of tachograph, the type of road conditions, the size of tyres and whether the instrument and drive cable were still sealed.
Tachograph installation is subject to tolerances so the analysis has to be conducted in the light of these tolerances. Paragraph 29 of the German statute on this subject compels owners to have their vehicles checked every year to ensure that the instrument and its adaptation are within the permitted tolerances and a certificate must be obtained confirming this. The acceptable tolerances at the time of installation are plus or minus 3 kph for the instrument plus lkm either way for the drive adaptation. After the installation is proved correct it is sealed.
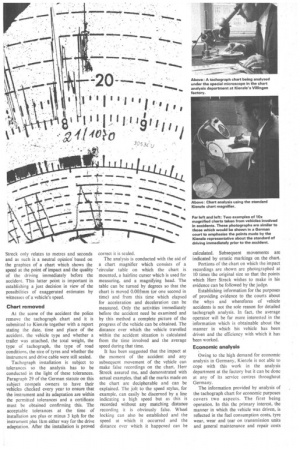
The analysis is conducted with the aid of a chart magnifier which consists of a 'circular table on which the chart is mounted, a hairline curser which is used for measuring, and a magnifying head. The table can be turned by degrees so that the chart is moved 0.003mm (or one second in time) and from this time which elapsed for acceleration and deceleration can be measured. Only the activities immediately before the accident need be examined and by this method a complete picture of the progress of the vehicle can be obtained. The distance over which the vehicle travelled within the accident situation is calculated from the time involved and the average speed during that time.
It has been suggested that the impact at the moment of the accident and any subsequent movement of the vehicle can make false recordings on the chart. Herr Streck assured me, and demonstrated with actual examples, that all the marks made on the chart are decipherable and can be explained. The jolt to the speed stylus, for example, can easily be discerned by a line indicating a high speed but as this is recorded without any matching distance recording it is obviously false. Wheel locking can also be established and the speed at which it occurred and the distance over which it happened can be calculated. Subsequent movements are indicated by erratic markings on the chart.
Portions of the chart on which the impact recordings are shown are photographed at 10 times the original size so that the points which Herr Streck wishes to make in his evidence can be followed by the judge.
Establishing information for the purposes of providing evidence to the courts about the whys and wherefores of vehicle accidents is not the sole reason for detailed tachograph analysis. In fact, the average operator will be far more interested in the information which is obtainable about the manner in which his vehicle has been driven and the efficiency with which it has been worked.
Economic analysis
Owing to the high demand for economic analysis in Germany, Kienzle is not able to cope with this work in the analysis department at the factory but it can be done at any of its service centres throughout Germany.
The information provided by analysis of the tachograph chart for economic purposes covers two aspects. The first being operation. In this the primary interest, the manner in which the vehicle was driven, is reflected in the fuel consumption costs, tyre wear, wear and tear on transmission units and general maintenance and repair costs