Transportivity Again
Page 46

If you've noticed an error in this article please click here to report it so we can fix it.
By JAN US
AT the very time when one might expect the leading characters in the British Transport Commission and the Road Haulage Executive to be grouping themselves on the stage in readiness for the tragic finale, each one of them in his own way strikes up an overture. Mr. A. W. Tait, the director of castings, has recently taken us through the story behind the setting-up by the B.T.C. of a traffic-costing service intended shortly to start operating.
' Mr. G. W. Quick Smith has told us of the first faltering steps towards a brave new world in which the trader will cast his bread upon the waters with the gay abandon of the girl posting her first love-letter, sublimely "indifferent to the mode of transport." Now we have Mr. S. E. Raymond, chief staff and welfare officer of the R.H.E., who invited members of the Institute of Transport the other day to consider whether the traditional method of paying transport workers by the hour should not be replaced in due course by a "properly measured and controlled incentive" based upon what the individual worker produces.
Mr. Raymond would scarcely be worth his salt at the B.T.C. table if he did not invite the Institute to consider his proposal as original. Any free-enterprise hauliers among his audience could have told him that incentive schemes and bonuses of various kinds are already provided by many companies. He was right to call attention to the problem of declining transportivity which must be causing a good deal of anxious thought within the R.H.E.
In industry as a whole productivity is going up. Figures issued by the information division of the Treasury reveal that in the first nine months of 1951 industrial production was 4 per cent. up on the same months of 1950, about half the annual rate of increase in the years 1948-1950. Manpower in the industries covered by the production index has risen annually in the past few years at the rate of about 2 per cent. These figures suggest that productivity, roughly speaking, rose 6 per cent. per year during 1948-50. In 1951 it is likely that productivity will not have been significantly higher than in the previous year.
Finding the Figure One simple method of arriving at a figure for the productivity of an industry is to take the average of the amount produced by all the workers in the industry. The same method may be used with a large concern. If it has 1,000 workers producing lm. units in a year, productivity may be taken as 1,000 units. If 1.2m. units were turned out in the following year with the same staff, productivity would be 1,200 units. In other words, it would have gone up by 20 per cent. If the number of workers had increased to 1,100, productivity would have risen only 11 per cent. to 1,090 units.
Certainly the R.H.E. is large enough for its transportivity to be assessed by this method. Even Mr. Raymond, who, as chief staff and welfare officer, should know if anybody does, is not certain how many people he has under his care. The nearest he can get is an approximation of 80,000. To meet our requirements there are more precise statistics for most of 1951 and for previous years.
el 2 The unit to be used in measuring transportivity may
vary according to taste. As the R.H.E. is carrying nearly 4tn. tons of traffic every month, it might be thought that variations in the monthly tonnage would provide a good guide to the amount of work carried out. Such a. survey might take into account that the kind of work changes significantly according to the .season. To make sure the comparison is between like and like, the figures must relate to the same period of each year under consideration.
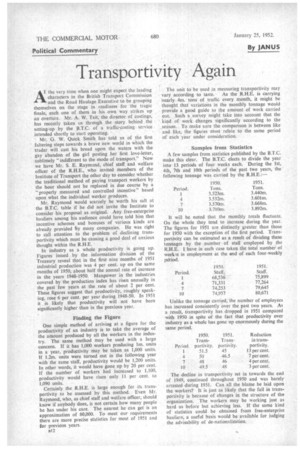
Samples from Statistics A few samples from statistics published by the B.T.C. make this clear. The B.T.C. elects to divide the year into 13 periods of four weeks each. During the 1st, 4th, 7th and 10th periods of the past two years, the following tonnage was carried by the R.H.E.:
It will be noted that the monthly totals fluctuate.
• On the whole they tend to increase during the year. The figures for 1951 are distinctly greater than those for 1950 with the exception of the first period. Transportivity can be estimated as a result of dividing these tonnages by the number of staff employed by the • R.H.E. I have in each case taken the total number of works in employment at the end of each four-weekly period.
Unlike the tonnage carried, the number of employees has increased consistently over the past two years. As a result, transportivity has dropped in 1951 compared with 1950 in spite of the fact that productivity over industry as a whole has gone up enormously during the same period.
The decline in transportivity set in towards the end of 1949, continued throughout 1950 and was barely arrested during 1951. Can all the blame be laid upon the workers? It is just as likely that the fall in transportivity is because of changes in the structure of the organization. The workers may be working just as hard as before but achieving less. If the same kind of statistics could be obtained from free-enterprise hauliers; a useful basis would be available for judging the advisability of de-nationalization.


