


When it Pays to Use Producer Gas
Page 37
Page 38
If you've noticed an error in this article please click here to report it so we can fix it.
Continuing and Embellishing the Comparative Figures of Costs in a Previous Article, When the Questions Concerning the Practicability and Economy of Producer Gas Were Debated IN a recent article on this subject I gave figures for the comparative operating costs for 5-ton 30 m.p.h. vehicles running on petrol and on producer gas. Those figures are reproduced herewith in Table I.
The fixed costs of the producer-gas vehicle are seen to be higher than those of the petrol vehicle by £40 in a year. The running costs are less by practically id. per mile. In 9,600 mile's, therefore, the extra fixed cost will be met by the saving in running costs, which means, apparently, that if a vehicle of this type covers more than 9,600 miles per annum it will pay to use producer gas, but that if it does not cover that mileage, it will not be economical to do so.
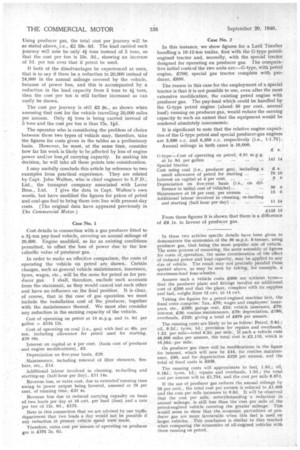
The savings possible per annum for various annual mileages were also calculated in the previous article. Those figures and some additional statistics are set out in Table II.
• Comparative Costs Not the Only Consideration •
The article concluded on a note of warning, to the effect that a choice between petrol and producer gas must not be made solely on comparative figures of costs. There are other matters to be taken into consideration. Of the several adverse factors which have a direct influence on costs, only two need immediate consideration. They arise from the loss of power when producer gas is used, instead of petrol, in a given size of engine, and the loss of loading space because of the room occupied by the producer-gas plant.
The effect of these two factors on operating costs cannot, unfortunately, be assessed in such a manner as to allow correction to be made in the figures quoted in this article. Their "effect varies according to circumstances. The loss of power, for example, may, be immaterial in cases where the vehicle is equipped with an engine of ample size. In such cases, there will be no noticeable diminution in the mileage which the vehicle can cover per week or per annum. The number of journeys which it can run per day will remain unaltered.
The diminution of loading space, too, may be something which need not trouble the operator as, for example, when the goods carried are heavy in proportion to bulk, so that the whole of the loading space of the vehicle is not normally utilized. Where they are bulky, but light, there may be a considerable diminution in the usefulness of the vehicle, because of the space taken up by the plant. These two factors may be cumulative, or they may be separate.
A vehicle may. suffer from loss of power as well as from loss of loading space. In some cases there will be only loss of power and no inconvenience because of the room taken up by the producer. In others room occupied by the producer will be a nuisance, but there will be no loss of power.
As indicating the way in which the figures of costs may be modified as the result of these matters,. it is of interest again to take the type of vehicle exemplified in the explanation of operating costs already given.
Assume first of all that the effect of the power loss is to reduce the annual mileage in the case of a vehicle covering 24,000 on petrol to 20,000. The standing charges are unaffected, remaining at £635. The running costs per mile are also at 2.57d. and the total of running costs per annum is, thus, £214 3s. 4d. The total cost per annum is £849 3s. 4d. and the total cost per mile 10.2d., as compared with 8.92d. had the vehicle been able to run the full 24,000 miles in the year.
Now, assume that the work done by this vehicle on petroi was to cover six journeys per week, each 40 miles out and 40 miles home, carrying 5 tons outwards and returning empty. The cost, had the vehicle been able to complete the 24,000 miles per annum using producer gas, would have been 80 times 8.92d. per journey. That is £2 19s. 6d. per journey, or 11s. 11d, per ton. The loss of power, however, has the effect of reducing the number of journeys per week from six to five and, as has been shown, increases the cost per mile from 8.92d. to 10.2d. The cost per journey thus becomes £3 8s., which is 13s. 7d. per ton.
The same vehicle running on petrol costs 9.52d. per mile, which is 23 3s. 6d. per journey, or 12s. 8d. per ton.
• Effect of Loss of Space Due to Gas Plant • If the vehicle load capacity be reduced because of the space occupied by the plant, and amounts to 10 per cent., then, on the understanding that the power reduction has no effect on the annual mileage, the resulting increase in costs will be as follow: On petrol the cost per ton will be, as before, 12s. 8d.
Using producer gas, the total cost per journey will be as stated above, i.e., £2 19s. 6d. The load carried each journey will nOW be only 4,1 tons instead of 5 tons, so that the cost per ton is 13s. 3d., showing an increase of 7d. per ton over that if petrol be used.
If both of the disadvantages be experienced at once, that is to say if there be a reduction to 20,000 instead of 24,000 in the annual mileage covered by the vehicle, because of power loss, and this is accompanied by a reduction in the load capacity from 5 tons to 4i tons, then the cost per ton is still further increased as can easily be shown.
The cost per journey is still £3 es., as shown when assessing that cost for the vehicle travelling 20,000 miles per annum. Only 4-i tons is being carried instead of 5 tons and the cost per ton is thus 15s. lid.
The operator who is considering the problem of choice between these two types of vehicle may, therefore, take the figures for costs given in the tables as a preliminary basis. However, he must, at the same time, consider how far his work is likely to be affected by loss of engine power and/or loss of carrying capacity. In making his decision, he will take all these points into consideration.
I may usefully conclude this article by reference to two examples from practical experience. They are related by Capt. John Walton, who is chief engineer to Ltd., the transport company associated with Lever Bros., Ltd. I give the data in Capt. Walton's own words, but have modified the figures for prices of petrol and coal-gas fuel to bring them into line with present-day costs. (The original data have appeared previously in The Commercial Motor.)
Case No. 1
Cost details in connection with a gas producer fitted to a 3i-ton pay-load vehicle, covering an annual mileage of 20,000. Engine modified, so far as existing conditions permitted, to offset the loss of power due to the low calorific value of producer gas.
In order to make an effective comparison, the costs of operating the vehicle on petrol are shown.. Certain charges, such as general vehicle maintenance, insurance, tyres, wages, etc.. will be the same for petrol as for pro
ducer gas. I shall, therefore, exclude such accounts from the statement, as they would cancel out each other and have no influence on the final position. It is clear, of course, that in the case of gas operation we must include the installation cost of the producer, together with the maintenance thereof. We must also consider any reduction in the earning capacity of the vehicle.
Cost of operating on petrol at 13 m.p.g. and Is. 9d. per gallon = £134 12s.
Cost of operating on coal (i.e., gas) with fuel at 46s. per ton, including allowance for petrol used for starting, £70 10s.
Interest on capital at 4 per cent. (basis cost of producer and engine modifications), £5.
Depreciation on five-year basis, £20.
Maintenance, including renewal of filter elements, fire. bars. etc., £14.
'Additional labour involved in cleaning, re-fuelling and starting-up (half-hour per day), Ell 14s.
. Revenue loss, or extra cost, due to extended"running time owing to power output being lowered, assessed at 20 per cent, of running time, £31 4s, Revenue loss due to reduced carrying capacity on basis of two loads per day at 10 cwt. per load (loss) and a rate per ton of 12s. 6d., £175.
Note in this connection that we are advised by our traffic department that two loads a day would not be possible if
any !eduction in present vehicle speed were, made. ' Therefore, extra cost per annum of operating on producer gas is £191 3s. 6d. Case No. 2
In this instance, we show figures for a Latil Traulier handling a 10-12-ton trailer, first with the G-type petrolengined tractor and, secondly, with the special tractor designed for operating on producer gas. The comparative initial costs of the two units are :—G-type, with petrol engine, £700; special gas tractor complete with producer, £850.
The reason in this case-for the employment of a special tractor is that it is not possible to use, even after the most extensive modification, the existing petrol engine with producer gas. The pay-load which could be handled by the G-type petrol engine (about 50 per cent. normal load) running on producer gas, would reduce the earning capacity to such an extent that the equipment would be rendered absolutely uneconomic.
It is significant to note that the relative engine capacities of the G-type petrol and special producer-gas engines are 3,680 c.c. and 6,350 c.c. respectively (i.e., 1-1.75).
Annual mileage in both cases is 10,000.
In these two articles specific details have been given to demonstrate the economies of the 30 m.p.h. 5-tonner, using producer gas, that being the most popular size of vehicle. The same process of reasoning, the same assembly of figures for costs of,operation, the same consideration of the effect of reduced power and load capacity, may be applied to any size of vehicle. The result may not precisely parallel those quoted above, as may be seen by taking, for example, a' maximum-load four-wheeler.
Assume such a vehicle costs £900 net without tyres-that the producer plant and fittings involve an additional cost of £200 and that the plant, complete with its.supplies and fuel, weighs from 12 cwt. to 14 cwt.
Taking the figures for a petrol-engined machine first, the fixed costs comprise: Tax, £70; wages and employees' insurance, etc., £200; garage rent, £24; vehicle insurance, £70; interest, £36; routine maintenance, £7.0; depreciation, £180; overheads, £220; giving a total of £870 per annum.
The running costs are likely to be as follow: Petrol, 3.8d.; oil, 0.2d.; tyres, 1d.; provision for repairs and overhauls, I.2d. per mile—total 6.24. per mile.. If such a vehicle runs 48,000 miles per annum, the total cost is £2,110, which is 10.55(1.---per mile. • On producer gas there will be modifications in the figure for interest, which will now be £44, for routine .maintenance, £90, and for depreciation £220 per annum, and the total of fixed costs is £938.
The running costs will approximate to fuel, 1.5d.; oil, 0.18d.; tyres, 1d.; repairs and overhauls, 1.3d.; the total cost per annum will be £1,734, and the cost per mile 8.67d.
If the use of producer gas reduces the annual mileage by 20 per cent., the total cost per annum is reduced to £1,600 and the cost per mile increases to 9.6d. It will be observed that the cost per mile, notwithstanding a reduction in annual mileage, is still less than the cost per mile of the petrol-engined vehicle covering the greater mileage: This would seem to show that the economic partialities of producer gas are more favourable when this fuel is used on larger vehicles. This conclusion is similar to that reached when comparing the economics of oil-engined vehicles with those running on petrol.