


costing for maximum profit
Page 39
Page 40
If you've noticed an error in this article please click here to report it so we can fix it.
A SPECIAL SERIES BY R. P. C. BLOCK
18. Proving the system
PROBABLY the most successful companies are those whose administration is removed from the area of the physical operation so that "thinking time" is not diverted by the distractions that arise through working on top of the job. The transport operator who intentionally removes himself and his admin. staff, including the cost analyst, to a place where he is not inhibited by "noises off' stands to gain far more in terms of profit and progress, than one who regards it as essential to be in constant touch with every facet of the operation.
The important statistics produced by the cost analyst for this, the penultimate chapter of this series, require intensive concentration, so the traffic office is hardly the place in which to locate him to prepare accurate information in the shortest time. Now that you have been introduced to budgetary control, from which standing and running costs are projected, once you have the monthly mileage for each vehicle group, you can calculate the running cost totals to which you add your budgeted standing costs to produce a rapid estimate of total cost. The Ornover figures required to complete the trading results should be available early in the month, so now the cost analyst can forecast the same within the first week. The estimated performance will then be confirmed or otherwise when the actual results are written up within the next two weeks.
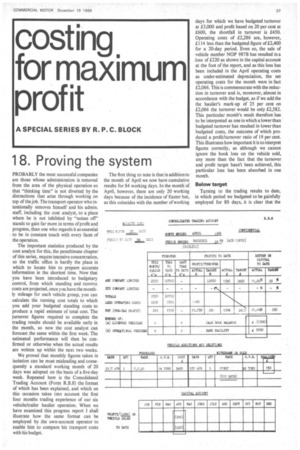
We proved that monthly figures taken in isolation can be most misleading and consequently a standard working month of 20 days was adopted on the basis of a five-day week. Repeated here is the Consolidated Trading Account (Form R.B.8) the format of which has been explained, and which on this occasion takes into account the first four months trading experience of our six vehicle/trailer haulier operation. When we have examined this progress report I shall illustrate how the same format can be employed by the own-account operator to enable him to compare his transport costs with his budget.
The first thing to note is that in addition to the month of April we now have cumulative results for 84 working days. En the month of April, however, there are only 20 working days because of the incidence of Easter but, as this coincides with the number of working
days for which we have budgeted turnover at £3,000 and profit based on 20 per cent at £600, the shortfall in turnover is £450. Operating costs of £2,286 are, however, £114 less than the budgeted figure of £2,400 for a 20-day period. Even so, the sale of vehicle number NOP 987B has resulted in a .loss of £220 as shown in the capital account at the foot of the report, and as this loss has been included in the April operating costs as under-estimated depreciation, the net operating costs for the month were in fact £2,066. This is commensurate with the reduction in turnover and is, moreover, almost in accordance with the budget, as if we add the the haulier's mark-up of 25 per cent on £2,066 the turnover would be only £2,582. This particular month's result therefore has to be interpreted as one in which a lower than budgeted turnover has resulted in lower than budgeted costs, the outcome of which produced a profit/turnover ratio of 19 per cent. This illustrates how important it is to interpret figures correctly, as although we cannot ignore the book loss on the vehicle sold, any more than the fact that the turnover and profit target hasn't been achieved, this particular loss has been absorbed in one month.
Below target Turning to the trading results to date, in which period we budgeted to be gainfully employed for 80 days, it is clear that the turnover target of £12,000 when compared with £10,712 actual, is minus £1,288. Against this, costs were budgeted at £9,600, but on account of lower trading and thus lower running costs these were £9,316 or £284 below budget. The result of the lower turnover and lower costs accounts for the profit of £1,396, i.e. 13.03 per cent on turnover as against the budgeted profit of £2,400 or 20 per cent on turnover.
The flow-line system now becomes invaluable as it is put into reverse, enabling the cost analyst to refer back to form R.B.7 on which individual vehicle performance and costs per month are recorded and from which he can check departures from the budget. Indeed, if need be, he can refer to the daily performance of each vehicle recorded on Form R.B.6. Of the four months' figures examined it is clear that there has been under-utilization and some unprofitable work, resulting in a below budget turnover. Operating costs at £9,314 consist of £5,736 standing and £3,580 running costs and although the total cost is below the budgeted figure, it is not low enough relative to the turnover. As previously emphasized, this is due to standing costs remaining unaffected by utilization or mileage.
Estimating the return
1 wrote about the return or yield on capital employed (CM December 5) and as I regard this as the most important yardstick of profit performance and for reasons already given I suggested that the haulier should set his sights on 20 per cent. You can see from the cost analyst's report how the yield has dropped from 17.30 per cent in the first month to 11.66 per cent at the end of the fourth month. It may seem strange, but even if the haulier had achieved his profit target of £2,400—all other things being equal—his yield would fall relative to the amount of profit ploughed back into the business, as until that profit is distributed he is adding to his capital employed. I am bound to say that this disregards the reduction in his overdraft, as money repayable on demand is not part of capital employed. However, when vehicles are purchased for cash and profits are being made, these profits, together with accumulated depreciation will, in the absence of other capital commitments, tend to increase the bank balance. In accountants' parlance this is referred to as generating a high "cash flow". On the other hand the value of the assets employed, e.g. vehicles, will reduce by the amount of depreciation set aside each month. This may appear to be a contradiction in terms but, what is happening is that the amount by which depreciation reduces the asset value is now in the form of cash at the Bank. Thus the extent to which the monthly profit exceeds depreciation is in very simple terms the amount by which the capital employed is being increased. The following illustration should clarify the point I am seeking to make, which is that ploughed-back profits add to capital employed, consequently unless retained profits generate additional profit at the same rate of return then the yield on the capital will decrease throughout the year.
Deterring poachers
Another source of profit elevation without increasing capital employed is through subcontracting. Clearly the more profit the haulier can earn without the introduction of fresh capital, the higher the return; thus what he can earn in commission is increasing his profit and yield by utilising the subcontractor's own investment. Obviously there are calculated risks, one of which is the possibility of the haulier's customers being poached. As a safeguard however, I suggest that the haulier should be as selective in the employment of sub-contractors as he would in the employment of drivers. As a deterrent, if the sub-contractors' accounts are settled on a date much earlier than could be expected from the haulier's customers, then both the risk of poaching and unreliability will be reduced.
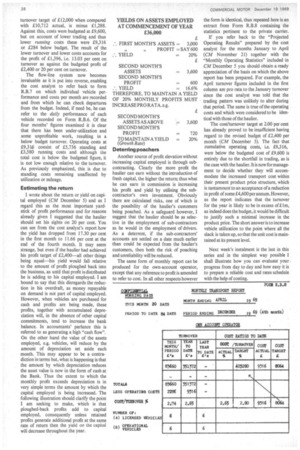
The same form of monthly report can be produced for the own-account operator, except that any reference to profit is amended to refer to cost. In all other respects however the form is identical, thus repeated here is an extract from Form R.B.8 containing the statistics pertinent to the private carrier.
If you refer back to the "Projected Operating Results" prepared by the cost analyst for the months January to April (CM November 21) together with the "Monthly Operating Statistics" included in CM December 5 you should obtain a ready appreciation of the basis on which the above report has been prepared. For example, the April turnover figures included in the first column are pro rata to the January turnover since the cost analyst was told that the trading pattern was unlikely to alter during that period. The same is true of the operating costs and which were considered to be identical with those of the haulier.
The cost/turnover target at 2.00 per cent has already proved to be insufficient having regard to the revised budget of £2,400 per month (CM December 5). The fact that cumulative operating costs, i.e. £9,316, were below the budgeted cost of £9,600 is entirely due to the shortfall in trading, as is the case with the haulier. It is now for management to decide whether they will accommodate the increased transport cost within their present product price structure, which is tantamount to an acceptance of a reduction in profit of some £4,600 per annum. However, as the report indicates that the turnover for the year is likely to be in excess °film, as indeed does the budget, it would be difficult to justify such a minimal increase in the product price. The short answer is to increase vehicle utilization to the point where all the slack is taken up, so that the unit cost is maintained at its present level.
Next week's instalment is the last in this series and in the simplest way possible I shall illustrate how you can evaluate your progress from day to day and how easy it is to prepare a reliable cost and rates schedule with the help of costing.