


PLANNING A BUS SERVICE
Page 46
Page 49
If you've noticed an error in this article please click here to report it so we can fix it.
to a housing estate
Figures, and Diagrams Explain the Fundamentals of Choosing Vehicle Types and Arranging Frequencies to Give the Best Service at Highest Profit
THE establishment of new scattered housing estates in various parts of the country is bringing many problems to the small bus proprietor. He secs, in the growth of these estates, possibilities for expansion of his business, and one of the things he must do is to study the problem and plan his service before he gets to work. Fhe alternative of trial and error causes loss of a lot of money before the solution is reached.
One must consider first the basic underlying principles and then apply them, taking the simplest problem as an example. Having in this way arrived at the method, provision can afterwards be made for complications.
There will be many readers of "The Commercial Motor whose experience of the establishment of new bus services is large. This article is not written for them; it is for the small man who has not hitherto found the necessity of planning a service in a systematic way before going to work on it. .
Bus-operating businesses suffer—or profit—as any enterprise must do. according to the proportion of overheads and their total costs in relation to output. In addition, however, any vehicle-operating concern has to take into account the incidence of standing charges, which are supplementary to overheads, although they have the same characteristic, inasmuch as their importance increases or diminishes in inverse ratio to the output. In the case of any vehicleoperating concern, output usually works out on the basis of vehicle miles per week or per annum. In other words, these two sets of expenses, put together, weigh more heavily as the weekly mileage falls, and correspondingly diminish in their effect as it rises.
In the case of a bus service, the output is more precisely measured in terms of passenger-miles, coupled, of course, with the fares which the passengers pay per mile run; in the solution of any problem affecting a bus service those are the principal considerations.
Relationship of Passengers and Miles
The operator has to be careful, too, for if, initially, he aims at increasing miles per week to reduce cost per mile. he may do himself harm, because he may not at the same time achieve a corresponding increase in passenger-mileage. It is not of much use to reduce the cost per mile—and, therefore, the cost per seat-mile--if many of those seats be empty all the time. The ultimate consideration, as in all transport problems, is revenue as against cost. In the case of a bus service, the revenue is from passengers carried. The cost is the cost per mile run.
Another important factor is that speed, together with frequency of service, is the primary need of the passenger. Those two considerations are, in point of fact, one, for if the passenger has to wait for a bus he loses time, which means that his speed, from point of arrival at the bus stop to his destination, diminishes the longer he has to wait for the next bus.
The operator, who is considering establishing a new service, should appreciate that those are the requirements.
and that if he does provide speed and frequency he will automatically experience a growing demand for the service and a gradual increase of passenger-mileage. What he does not know is how long it will take for that demand to grow to such an extent as to justify a frequent and speedy service, which, in the beginning. may show a loss.
As an illustration I have chosen what is admittedly a simple example, but is, nevertheless, one which, in its essentials, frequently recurs in the form of a problem for the operator.
I have taken a route from A to 13, a distance of zU: miles, travelling through a sparsely populated area, having reason able prospects of traffic being picked up fairly regularly along the route in each direction, with not much in the way of a peak load, although there are times in the day when the service may be diminished or its frequency lowered without affecting its popularity.
I am going to assume that the operator, as the outcome of a preliminary check, calculates that, for a period a eight hours each day—say, three in the morning, two at mid-day and three towards the evening—there will be 50 people per hour along the route who are willing to travel, not all the way, but from point to point, so that he will be picking up and setting down here and there between A and B.
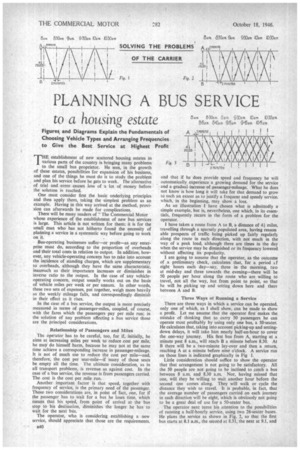
Three Ways of Running a Service
There are three ways in which a service can be operated, only one of which, as I shall show, can be made to show a profit. Let me assume that the operator first makes the mistake of thinking that to carry 50 passengers he can operate most profitably by using only one bus, a 50-seater. He calculates that, taking into account picking-up and settingdown delays, it will take him nearly half-an-hour to cover the one-way journey. His first bus from A, starting at a minute past 8 a.m., will reach B a minute before 8.30. At 13 there will be a two-minute lay-over and then a return, reaching A at a minute before nine o'clock. A service run on those lines is indicated graphically in Fig 1.
Little consideration should suffice to show the operator that that arrangement is not going to be satisfactory. All the 50 people are not going to be inclined to _catch a bus between 8 a.m. and 8.30 a.m. Nor, having missed that one, will they be willing to wait another hour before the second one comes along. They will walk or cycle the distance they wish to travel. It is probable, in fact, that the average number of passengers carried on each journey in each direction will be eight, which is obviously not going to be a great deal of use for a 50-seater bus. The operator next turns his attention to the possibilities of running a half-hourly service, using two 26-seater buses. tie plans the service as shown in Fig. 2, so that the first bus starts at 8.1 a.m., the second at 8.31, the next at 9.1, and so on. Again, on consideration, he is apprehensive that the frequency of service will not satisfy his prospective clientele He may possibly get an average of 10 passengers per journey throughout the eight working hours, and without going into calculations he is dubious of his success.
It then occurs to the operator that with a 20-seater bus there will be no need, in law, for him to have a conductor. He can work the service on a "pay as you enter" plan and let the driver serve the dual purpose of driver and conductor.
Considering that as a basis of economy, he turns his mind to the possibilities of running four 20-seater buses over the service, giving a I5-minute frequency, as shown in Fig. 3. Then he thinks he may average 12 passengers per trip, thus collecting, to all intents and purposes, the full 50 passengers per hour which he expected.
The operator then decides to deal with the problem more directly on the basis of cost and revenue, and, by comparing these two, arriving at a potential loss or profit. As regards the 50-seater, the initial item in this calculation is, of course, the capital outlay on the vehicle and its resultant effect on his costs by way of interest and depreciation, more usually referred to in this connection as interest and sinking fund. He finds that he can probably obtain .a suitable vehicle for £2,500. The interest on that sum at 2 per cent. is £50 per annum; the sinking fund or depreciation, taking a period of six.years, is £418 per annum, so that the total interest and sinking fund is £468.
The next item is tax, which is £79 4s. Then the operator must make an estimate of the proper proportion of his administrative charges, including garage, office insurance, and so on, and he arrives at a figure of £360 per annum as being a fair allocation for a 50-seater bus operated in such a way. The fbregoing are, in effect, his overheads and standing charges combined.
Method No. I Involves Loss He now refers to Fig. 1, and calculates that in a six-day week the vehicle will run 432 miles—say, 21,600 miles per annum. The total of his overheads and standing charges, as already indicated, is £907. He divides that £907 by the mileage, 21,600, and obtains, within a small fraction, 10d. per mile as being the sum of that portion of his expenditure.
One more item, referred to in passenger-vehicle language as platform expense, is the wages of the driver and conductor. On the basis of £9 per 48 hours, during which the vehicle covers 432 miles, that sum equals 5d. per mile.
There are still running costs to be considered. These may be taken as follow: Petrol, 2.7d. per mile; oil, 0.2d.; tyres, 1.5d.; and maintenance, 1.9d.; total, 6.3d... Adding these three amounts together, the cost per mile is 21.3d.
Turning to the revenue side and assessing fares on the basis of I id. per mile per passenger, it immediately becomes obvious that, if only eight passengers be carried, the revenue will be more than Is. per mile, and the loss will be 9.3d. for every mile run. Figures emphatically confirm the conclusion already drawn as regards the impracticability of running this service with one 50-seater bus.
In the case of the 26-seater, the overheads and standing charges can be briefly summarized as follow:—Interest and sinking fund, £373; tax, £48; administrative expenses, garage, interest, etc., £280; total, £701, which, for the same mileage as before, is equivalent to 7.78d. per mile.
Platform costs will be the same—this is one of the disadvantages of a smaller vehicle—so we add first another 5d., making 12.78d. for what are ail, in effect, standing charges or overheads.
Running Cost for a 26-seater For running costs the figures will probably approximate to the following:—Petrol, 2.2d.; oil, 0.17d.; tyres, 1.40d.; maintenance, 1.45d.; total, 5.22d. per mile. Adding that sum to the standing charges of 12.78d., we get a total running cost of 18d. per mile.
The expectation of traffic was an average of 10 passengers throughout the journey, and, at an average fare of lid. per mile, the revenue is 15d. per mile. The net loss is, therefore, 3d. per mile run per vehicle, a total of 6d. per mile or £10 16s. per week for the enterprise.
It now seems as though, unless the 20-seater can be shown to be a practicable proposition, the operator is going to have difficulty in meeting the requirements of this neighbourhood.
In connection with a 20-seater, the interest and sinking fund amount to £.324, tax to £36, and administrative expenses, overheads, garage, insurance, etc., to £200. The total is £560. which, on the same mileage as before, equals 6.3d. per mile.
Platform costs are greatly diminished, as for this vehicle there is only the driver to pay. On an average of £5 per week for wages, the cost is 3.6d. per mile, so that up to now we have 9.9d. per mite for what are, in effect, overheads and standing charges.
For running costs the following figures .apply:—Petrol. 2.Id. per mile; oil, 0.12d.; tyres, 1.30d.; maintenance, 1.18d. The total is 4.70d., which, added to 9.9d., gives us 14.6d. per mile as the total cost.
The average traffic has been assessed, and reasonably so, at 12 passengers per mile, and revenue, at I id. per passengermile, will be 18d. per mile. Consequently, there is a net profit of 3.4d. per mile per vehicle, or 13.6 per mile for the average of four buses. The total profit per week on that basis is almost £24 10s. S.T.R.