


PROBLEMS OF THE HAULIER AND CARRIER.
Page 65
Page 66
If you've noticed an error in this article please click here to report it so we can fix it.
Continuing the Discussion on the Relationship Between Passenger Fares and the Carrying Capacity of Motor Coaches.
T CAME to the end of my last article in the middle 1 of a discussion on how to select the most suitable size of motor coach. The subject seemed to me to be a timely one both because the current coaching season is now closing and because of the imminence of the Commercial Vehicle Show at Olympia, which will offer many opportunities to coach owners, present and prospective, to make their choice of new vehicles. One thing, however, which cannot be learnt by a visit to Olympia, is how the revenue from a coach is affected by its seating capacity.
The Bigger the Coach the Lower the Fare.
The principal matter to which I directed attention in the preceding article was the idea prevalent amongst a good many coach owners that the smaller the coach the lower might be the fare. They had evidently obtained the impression from the fact that the smaller coach costs less to run. I showed that this method of reasoning was wrong and that, as a matter of fact, the reverse is the case. Other things being equal, the larger the coach—i.e., the greater its seating capacity— the cheaper the fare. I explained how this came to be and cited asexamples the 20-seater and the 32-seater
coaches. I showed that if both were operating 700 miles a week the fares on the 20-seater would have to be 4s. 6d, for a hundred-mile trip as against 3s. 'W. on the 32-seater. That is assuming a full load each trip. I further demonstrated that even if they were only carrying two-thirds of their rated total number of passengers the corresponding fares would be Os. 3d. and as. 6d., the difference being still the same—i.e., about 9d. in favour of the larger vehicle.
Coach Must be the Right Size.
One thing, however, was evident. Given the same number of passengers for both types then, if the smaller vehicle could carry them, the smaller one was the more profitable, for, assuming 14 paasengers only, the fare on the 20-seater would still remain at Gs. 3d., whilst that on the 32-seater would have to be 8s. 4d. in order to maintain the profit at the agreed figure. This, of .course, Is the crux of the whole question. The prospective buyer most have definite ideas as to the number of people he can expect to carry on the average throughout the season. Ile must not be misled by the occurrence of bumper loads from time to time, for, whilst it is no doubt very disappointing to have to turn passengers away occasionally, it is a much more serious matter if, for the sake of carrying 32 passengers half
a-dozen times in a year, he runs a 32-seater coach on the remaining hundred and odd journeys with an average of not more than 14 or 15 seats occupied.
It is practically impossible to arrange matters so that a full load is carried on every trip, unless the coach be obviously undersized, and the figure to aim at is twothirds to three-quarters of the seating capacity. Reckon the fares on that basis and then, when the load falls below that level, there will be the feeling that the loss incurred on that trip is counterbalanced by the additional profit resulting from a full load, assuming, of course, that a full load does come along often enough to make up the balance. It usually does.
Same Figures for Fares.
In the accompanying tables figures are given which will be of use to the coach owner in a variety of circumstances when he is endeavouring to ascertain what his fares should be for any particular trip. The basis for calculation is an average of 500 miles a week, whilst the fares themselves are reckoned for a trip of 100 miles, out and home; that is to say, 50 miles outwards and 50 miles return.
In Table I figures for cost of operation, establishment charges and weekly profit are..,set clown in accordance with The Commercial Motor Tables of Operating Costs. These figures added together give the minimum revenue which must be obtained in order to afford the profit shown. In the last line of this tabulation the figure for the fare per passenger for a 100-mile trip is given, assuming Ilte vehicle to be fully loaded. This will not in ordinary circumstances be sufficiently high to make the coach a profitable investment throughout a season. To ascertain that figure it must be assumed that a two-thirds load only will be carried, in which circumstances the fare will be half as much again as that quoted. The correct fare is given with obher figures in Table n, to which I will refer in a moment.
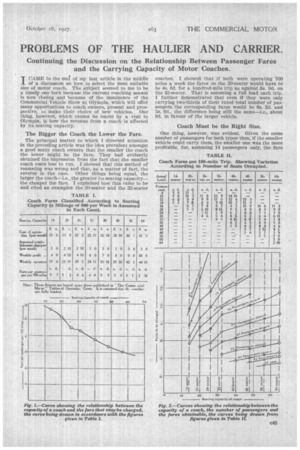
Meantime, it is of Interest to note how the fare gradually falls as the size of the coach increases, but notin direct proportion to the increase in 'seating capacity. For example, whilst the fare chargeable on a 14-seater is 5s. Ti]., that on a 56-seater -carrying four times the number of passengers is 3s. 1d., which is a little more than half the fare on the 14-seater. Again, on the 32-seater the fare is 4s. 4d., whilst on the 64seater carrying twice as many passengers the fare is 2s. 10d.
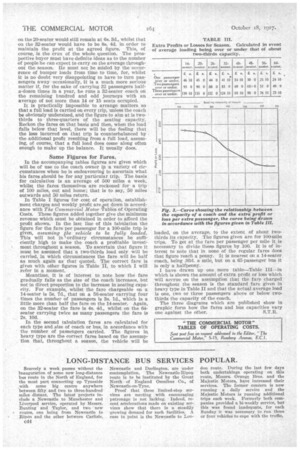
In the second tabulation fares are calculated for each type and size of coach or bus, in accordance with the number of passengers carried. The figures in, heavy type are the correct fares based on the assumption that, throughout a season, the vehicle will be
loaded, on the average, to the extent of about twothirds its capacity. The figures given are for 100-Mile TO get at the fare per passenger per mile it is necessary to divide these figures by 100. It is of interest to note that in none of the regular fares does that figure reach a penny. It is nearest on a 14-seater. ceach, being .93d. a mile, but on a 65-passenger bus it is only a halfpenny. have drawn up one more table—Table which is shown the .amount of extra profit or loss which will accrue on the assumption that the fare charged throughout the season is the standard fare given in heavy type in Table II and that the actual average load is one, two or three passengers above or below twothirds the capacity of the coach.
The three diagrams which are published show in graphic form how the fares and bus capacities vary one against the other. S.T.R.