


ROAD TEST RESULTS PROM GOODS VEHICLE PROGRESS
Page 42
Page 43
Page 44
If you've noticed an error in this article please click here to report it so we can fix it.
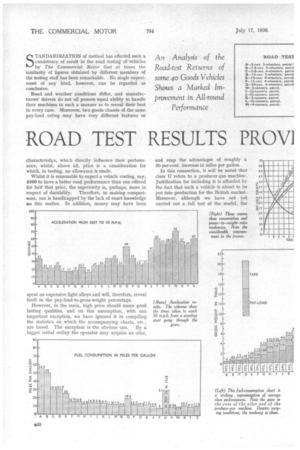
STANDARDIZATION of method has effected such a consistency of result in the road testing Of vehicles by The Commercial Motor that at times the similarity of figures obtained by different members of the testing staff has been remarkable. No single experiment of any kind, however, can be regarded as conclusive.
Road and weather conditions differ, and manufacturers' drivers do not all possess equal ability to handle their machines in such a manner as to reveal their best in every case. Moreover, two goods chassis of the same pay-load rating may have very different features or
characteristics, which directly influence their performance, whilst, above all, price is a consideration for which, in testing, no allowance is made.
• Whilst it is reasonable to expect a vehicle costing, say, £600 to have a better road performance than one offered for half that price, the superiority is, perhaps, more in 'respect of durability. Therefore, in making comparisons, one is handicapped by the lack of exact knowledge on this matter. In addition, money may. have been
spent on expensive light alloys and will, therefore, reveal itself in the pay-load-to-gross-weight percentage.
However, in the main, high price should mean good lasting qualifies, and on this assumption, with one important exception, we have ignored it in compiling the statistics on which the accompanying charts, etc., are based. The exception is the obvious one. By a bigger initial outlay the operator may acquire an oiler,
and reap the advantages of roughly a 50-per-cent. increase in miles per gallon.
In this connection, it will be noted that class U refers to a producer-gas machine. Justification for including it is afforded by the fact that such a vehicle is about to be put into production for the British market. Moreover, although we have not yet carried out a full test of the model, the figures quoted against letter U are those obtained by us in a trial on the road, under similar conditions to the others, and in which a number of our standard tests was included.
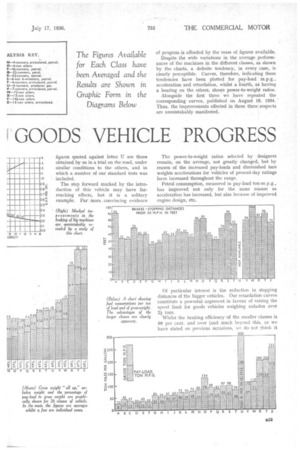
The step forward marked by the introduction of this vehicle may have farreaching effects, but it is a solitary example. Far more convincing evidence of progress is afforded by the mass of figures available.
Despite the wide variations in the average performances of the machines in the different classes, as shown by the charts, a definite tendency, in every case, is clearly perceptible. Curves, therefore, indicating these tendencies have been plotted for pay-load m.p.g., acceleration and retardation, whilst a fourth, as having a bearing on the others, shows power-to-weight ratios.
Alongside the first three we .have repeated the corresponding curves, published on August 10, 1934. Thus, the improvements effected in these three respects are unmistakably manifested.
The power-to-weight ratios selected by designers remain, on the average, not greatly changed, but by reason of the increased pay-loads and diminished tare weights accelerations for vehicles of present-day ratings have increased throughout the range.
Petrol consumption, measured in pay-load ton-m.p.g., has improved not only for the same reason as acceleration has increased, but also because of improved engine design, etc.
Of particular interest is the reduction in stopping distances of the bigger vehicles. Our retardation curves constitute a powerful argument in favour of raising the speed limit for goods vehicles weighing unladen over 2i. tons.
Whilst the braking efficiency. of the smaller classes is 50 per cent. and over (and much beyond this, as we have stated on previous occasions, we do not think it leo
desirable to go), that of the machines of the maximum legal gross weight is not far short of 40 per cent. Their stopping distances are a matter of only a few yards longer.
There is, of course, an occasional chassis which is markedly inferior in respect of braking efficiency or on other counts, but these are few and far between. We have based our retardation curve on what may be regarded as good modern average performances.
No consumption curves for oibengined vehicles have been drawn, because sufficient data were not available for representative conclusions to be formed. The actual average figures for oilers are shown in the charts. It will be observed that the 1934 curves go up to only 12 tons. Prior to that date there were few makers building machines for loads over that figure which did not weigh more than 10 tons when unladen.
There is an extension, also, at the other end of the scale, a 3-cwt. three-wheeler having been introduced during the past year. In its case, the figures quoted are those obtained from a test of only the one vehicle. In certain other classes the same applies, but, nevertheless, the returns are valuable.
Most representative are the figures in the 3-ton class, which are the averages from the results of tests of six different makes.
An interesting point is the absence of petrol vehicles from the bigger categories, where oil fuel now seems to be far more generally used.
Although short of the ideal, which would be based on averages calculated from every type and every make, we know of no better standard for comparison than this analysis of road-test results, It should be of great valu* to manufacturer and operator alike.
MHO
M
Illi•
2 a 4 5 6 7 .8 9 10 la 13 A. 15
TONS PAY-LOAD CAPACITY