 1
1 2
2 3
3 4
4 5
5 6
6 7
7 8
8 9
9 10
10 11
11 12
12 13
13 14
14 15
15 16
16 17
17 18
18 19
19 20
20 21
21 22
22 23
23 24
24 25
25 26
26 27
27 28
28 29
29 30
30 31
31 32
32 33
33 34
34 35
35 36
36 37
37 38
38 39
39 40
40 41
41 42
42 43
43 44
44 45
45 46
46 47
47 48
48 49
49 50
50 51
51 52
52 53
53 54
54 55
55 56
56 57
57 58
58 59
59 60
60 61
61 62
62 63
63 64
64 65
65 66
66 67
67 68
68 69
69 70
70 71
71 72
72 73
73 74
74 75
75 76
76 77
77 78
78 79
79 80
80 81
81 82
82 83
83 84
84 85
85 86
86 87
87 88
88 89
89 90
90 91
91 92
92 93
93 94
94 95
95 96
96 97
97 98
98 99
99 100
100 101
101 102
102 103
103 104
104 105
105 106
106 107
107 108
108 109
109 110
110 111
111 112
112 113
113 114
114 115
115 116
116 117
117 118
118 119
119 120
120 121
121 122
122 123
123 124
124 125
125 126
126 127
127 128
128 129
129 130
130 131
131 132
132 133
133 134
134 135
135 136
136 137
137 138
138 139
139 140
140 141
141 142
142 143
143 144
144 145
145 146
146 147
147 148
148 149
149 150
150 151
151 152
152 153
153 154
154 155
155 156
156 157
157 158
158 159
159 160
160 161
161 162
162 163
163 164
164 165
165 166
166 167
167 168
168 169
169 170
170 171
171 172
172 173
173 174
174 175
175 176
176 177
177 178
178 179
179 180
180 The Progress
Page 86
Page 87
If you've noticed an error in this article please click here to report it so we can fix it.
and Status
of
the
ROAD -TRANSF
DRT INDUSTRY
THE task of recording the progress of the road transport industry becomes greater year by year. When the attempt was first made (by the present writer) in 1914-15 the records secured furnished parlculars of 331 undertakings, mostly being passenger:tarrying concerns. By 1920 the records had grown to 300 companies and by 1926 to 3,297.
To-day there are approximately 4,000 transportDperating undertakings, of which some material particulars are available, and it will be appreciated that the task of compiling and collating the data of such a number of undertakings is no light one.
The industry grows steadily and it is of interest to note that of the 4,000 transport undertakings now on the register 1,490 are private firms and individuals, fairly evenly distributed between the goods and passenger sides of the industry.
It has to be recognized that the industry offers much scope for the enterprise of individuals in urban, as well as rural, areas, but particularly in the latter, as the business of public transport is not one calling for excessively large capital expenditure, but the fact that so many unincorporated concerns participate in the activities of the industry, of course, makes it extremely difficult to obtain full particulars of such matters as the number of vehicles employed, nature and details of operations, and the capital invested-which are considered to be "private."
Over £55,000,000 Invested in Public Road Transport.
Growing legislative control will probably effect a Change in this matter-at any rate, so far as the passenger-transport side of the industry is concernedbut in the meantime we have to make the best of the material available. Fortunately, the data actually gathered together cover all concerns of much consequence, and serve, therefore, as a fairly reliable guide to the status and importance of the industry. One striking indication of its importance lies In the figures of capital invested. An analysis of the data reveals the fact that 1,899 undertakings have a total of approximately £55,683,500 invested in the provision of public-motor-service facilities (public goods and passenger services).
This is over £7,000,000 more than the figures for the previous year and the following table, showing the annual progress in recent years, reveals that during the past five years the capital has been doubled : The formation of new enterprises, despite the industrial and trade depression during the year-which, of course, has had a hampering effect-still goes forward. Since March, 1930, to date, nearly 250 new companies, capitalized at approximately £2,000,000, have been formed to carry on business in some department of road transport.
Most of them are quite small concerns, only three having authorized capitals running into six figures, and these are not new enterprises in the strict sense, but reorganizations of existing undertakings.
E24 For our present purpose, however, the main point of interest in these statistics lies not so much in the rapidity of development in general as in the rate of progress shown by commercial (passenger and goods) vehicles, the extent of the public road-transport industry of to-day, and its influence on the social and industrial life of the nation.
It is not a difficult matter to visualize in a general way the prime importance of the services rendered by public goods and passenger vehicles, but it is practically impossible to estimate their full economic and social value to the community.
With their power to penetrate into remote and isolated villages, linking rural by-ways with the market towns and the larger industrial centres-to the inestimable advantage of industry and commerce-they are also contributing (particularly the motorbus) towards a solution of that problem of the depopulation of the country-side, which for generations has baffled the minds of statesmen and the efforts of political economists.
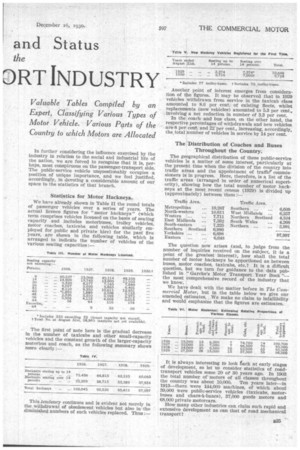
Further Explanation of Table II.
In Table II, in the column dealing with goods vehicles, it May be noted that the total for 1928, shows an increase of 19,600 over the figures for 1927, and the total for 1929 an increase of 23,700 over that of 1928, whilst the total for 1930 shows an increase of 7,800 over the previous year. This does not indicate, as might be assumed, that there is any falling off in the demand for commercial-motor vehicles; the demand, this year, in fact, has been greater than during last year.
In 1929 (year ended August 31st) 49,710 new goods vehicles were placed in service, and 26,010 were withdrawn (mainly on account of obsolescence). In 1930 (year ended August 31st) 52,750 new vehicles were added, and, during the same period, 44,950 were withdrawn. The modernizing of fleets is, fortunately, a constant factor. In further considering the influence exercised by the industry in relation to the social and industrial life of the nation, we are forced to recognize that it 18, perhaps, most conspicuous on the passenger-transport side. The public-service vehicle unquestionably occupies a position of unique importance, and we feel justified, accordingly, in devoting a considerable amount of our space to the statistics of that branch.
Statistics for Motor Hackneys.
We have already shown in Table II the round totals of passenger vehicles over a series of years. The actual licence figures for "motor hackneys" (which term comprises vehicles licensed on the basis of seating capacity and includes motorbuses, trolley vehicles, motor coaches, taxicabs and vehicles similarly employed for public and private hire) •for the past five years, are shown in the following table, which is arranged to indicate the number of vehicles of the various seating capacities:
The first point of note here is the gradual decrease in the number of taxicabs and other small-capacity vehicles and the constant growth of the larger-capacity motorbus and coach, as the following summary shows more clearly : This .tendency continues and is evident not merely in the withdrawal of obsolescent vehicles but also in the diminished numbers of such vehicles replaced. Thus: Another point of interest emerges from consideration of the figures. It may be observed that in 1929 vehicles withdrawn from service in the taxicab class amounted to 8.6 per cent, of existing fleets, whilst replacements (new vehicles) amounted to 5.3 per cent., involving a net reduction in number of 3.3 per cent.
In the coach and bus class, on the other hand, the respective percentages of withdrawals and new vehicles are8 per cent. and 22 per cent., increasing, accordingly, the total number of vehicles in service by 14 per cent.
The -Distribution of Coaches and Buses Throughout the Country.
The geographical distribution of these public-service vehicles is a matter of some interest, particularly at the present time when the division of the country into traffic areas and the appointment of traffic° commissioners is in progress. Here, therefore, is a list of the traffic areas (arranged in order of numerical superiority), showing how the total number of motor hackneys at the most recent census (1929) is divided up (approximately) between them :
The question now arises (and, to judge from the number of inquiries received on the subject, it is a point of the greatest interest), how shall the total number of motor hackneys be apportioned as between buses, motor coaches, taxicabs, etc.? It is a difficult question, but we turn for guidance to the data published in " Garcke's Motor Transport Year Book "the most comprehensive record of the industry that we know.
We have dealt with the matter before in The Commercial Motor, but in the table below we give our amended estimates. We make no claim to infallibility and would emphasize that the figures are estimates.
It is always interesting to look sack at early stages of development, so let us consider statistics of roadtransport vehicles some 20 of 30 years ago. In 1903 the total number of motors of all classes throughout the country was about 10,000. Ten years later-in 1913-there were 144,000 machines, of which about 39,000 were public-service vehicles (taxicabs, motorbuses and chars-A-bancs), 37,000 goods motors and 68,000 private motorcars.
How many other industries can, claim such rapid and extensive development as can that of road mechanical transport?