 1
1 2
2 3
3 4
4 5
5 6
6 7
7 8
8 9
9 10
10 11
11 12
12 13
13 14
14 15
15 16
16 17
17 18
18 19
19 20
20 21
21 22
22 23
23 24
24 25
25 26
26 27
27 28
28 29
29 30
30 31
31 32
32 33
33 34
34 35
35 36
36 37
37 38
38 39
39 40
40 41
41 42
42 43
43 44
44 45
45 46
46 47
47 48
48 49
49 50
50 51
51 52
52 53
53 54
54 55
55 56
56 57
57 58
58 59
59 60
60 61
61 62
62 63
63 64
64 65
65 66
66 67
67 68
68 69
69 70
70 71
71 72
72 73
73 74
74 75
75 76
76 77
77 78
78 79
79 80
80 81
81 82
82 83
83 84
84 85
85 86
86 87
87 88
88 89
89 90
90 91
91 92
92 93
93 94
94 95
95 96
96 97
97 98
98 99
99 100
100 101
101 102
102 103
103 104
104 105
105 106
106 107
107 108
108 109
109 110
110 111
111 112
112 113
113 114
114 115
115 116
116 117
117 118
118 119
119 120
120 121
121 122
122 123
123 124
124 125
125 126
126 127
127 128
128 129
129 130
130 131
131 132
132 133
133 134
134 135
135 136
136 137
137 138
138 139
139 140
140 Set your targets for productivity
Page 48
Page 49
Page 50
If you've noticed an error in this article please click here to report it so we can fix it.
Be specific, don't aim to cut a fuel bill by Lx, but set an mpg figure for each vehicle, David Wilcox sums up latest pdm report
IN 1978 a survey was made of the physical distribution activities of 1000 American companies, attempting to find out the productivity levels that were being achieved.
Applying the findings to all American companies it was concluded that there were enormous potential savings to be made by improving physical distribution productivity — 40 'billion dollars, to be exact. The survey was commissioned by the National Council for Physical Distribution Management.
Its equivalent organisation in the United Kingdom, the Centre for Physical Distribution Management, decided to carry out a similar exercise in this country and last year 1001 CPDM member companies received a detailed questionnaire to complete. The same management consultancy company that worked on the USA survey, A. T, Kearney, was engaged to analyse the UK survey results.
Before looking at the findings it will help if I briefly explain Kearney's thinking on productivity in physical distribution. As consultants, A. T. Kearney has experience in advising many US companies of pdm techniques. To make their ideas known over here three of Kearney's pdm experts made a three-stop lecture tour in the UK last October. (CM October 12, 1979).
As CM reported then, the company's message was
it is the actual transport aspect of physical distribution that offers the biggest potential productivity improvement.
"Catch productivity fever". By this they meant that you must make the effort and work at improving physical distribution productivity. And the more you examine the business the more potential savings will come apparent.
Too many people and companies think that productivity concerns just drivers and warehousemen. But Kearney says every part of the physical distribution business can be put under the productivity microscope and show worthwhile improvements. This includes transport (both in and out), warehousing, inventory control, product planning, administration, order processing and management. And machinery and equipment must also be assessed for its productivity, as well as people. To achieve better productivity you must obviously be able to measure it. This, says Kearney, concentrates the effort and enables a company to monitor its progress. For every aspect of the pdm operation a goal must be set. These goals should be in realistic figures rather than financial terms. For instance, rather than saying the fuel bill must be cut by EX, an mpg target should be set for each vehicle.
Progress towards all these targets should be monitored in easy to read form. Don't use a stack of meaningless figures tucked away in the transport manager's drawer. Simple, straight-forward charts or graphs where everyone can see them are what is needed.
That, briefly, is the thinking behind Kearney's productivity lesson for physical distribution. .Last October, while many senior pdm managers were hearing these ideas in Kearney's lectures, British companies were completing the UK survey questionnaire to see how productivity-conscious they really are and what scope for improvement there is.
The findings of that survey have now been published. In a preamble to the results the CPDM and Kearney have pointed out that the findings are not necessarily representative of all British industry, All those companies who participated in the survey were already CPDM members and had previously shown that they were pro-pdm Of the 1001 questionnaires that were sent out to the CPDM member companies 100 were filled out and returned. This, while disappointingly low, is a typical level of response. It did not mean the survery was in consequential; the combined annual turnover of the respon dents exceeded £8000 million and ranged from £10 million to £1000 million per year. Two thirds of them ran their own delivery vehicle fleet for either trunking or distribution.
Most of those companies which replied were manufac turing concerns making a wide range of products from paints to electrical goods and food. The remainder of the respondents were retailers such as shop chains, wholesalers and other service companies such as distribution companies.
Kearney identified three levels of sophistication or ad vancement towards good physical distribution productivity and from the questionnaire classified each company into one of these three levels.
At the first, the most elementary level, any productivity measures are likely to be limited to quarterly financial figures. The second level would include measures such as cost per tonne or cost per drop. The third and most advanced level involves companies setting targets for" such things as daily load-outs, load factors, vehicle downtime and mpg and utilisation of equipment.
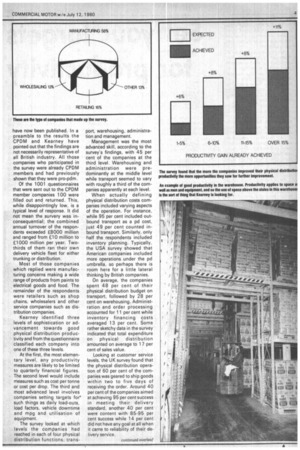
The survey looked at which levels the companies had reached in each of four physical distribution functions; trans port, warehousing, administration and management. Management was the most advanced skill, according to the survey's findings, with 45 per cent of the companies at the third level. Warehousing and administration were predominantly at the middle level while transport seemed to vary with roughly a third of the companies apparently at each level.
When actually defining physical distribution costs companies included varying aspects of the operation. For instance, while 95 per cent included outbound transport as a pd cost, just 49 per cent counted inbound transport. Similarly, only half the respondents included inventory planning. Typically, the USA survey showed that American companies included more operations under the pd umbrella, so perhaps there is room here for a little lateral thinking by British companies.
On average, the companies spent 48 per cent of their physical distribution budget on transport, followed by 28 per cent on warehousing. Administration and order processing accounted for 11 per cent while inventory financing costs averaged 13 per cent. Some rather sketchy data in the survey indicated that total expenditure on physical distribution amounted on average to 17 per cent of sales value.
Looking at customer service levels, the UK survey found that the physical distribution operation of 60 per cent of the companies was geared to ship goods within two to five days of receiving the order. Around 40 per cent of the companies aimed at achieving 95 per cent success in meeting their delivery standard, another 40 per cent were content with 85-95 per cent success while 14 per cent did not have any goal at all when it came to reliability of their delivery service. Productivity measurement of the transport function was relatively high. Many companies were monitoring such things as load factor and downtime per centages, but the report also mentions that a "significant" number were not even measuring their fuel consumption.
Predictably, on the warehousing side, conventional warehousing still predominates over the high rise variety. The 'Kearney report notes that while 65-70 per cent of the companies monitored labour productivity in their warehouses only 20-25 per cent measured the productivity of the machinery and equipment.
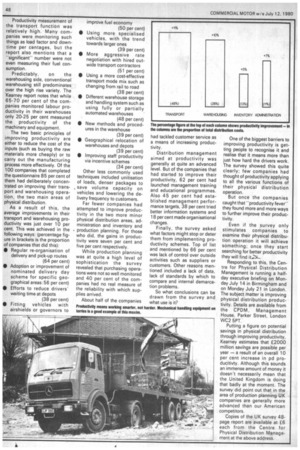
The two basic principles of improving productivity are either to reduce the cost of the inputs (such as buying the raw materials more cheaply) or to carry out the manufacturing process more effectively. Of the 100 companies that completed the questionnaire 85 per cent of them had deliberately concentrated on improving their transport and warehousing operation, the two main areas of physical distribution.
As a result of this, the average improvements in their transport and warehousing productivity was just over 10 per cent. This was achieved in the following ways: (percentage figure in brackets is the proportion of companies that did this): • Regular re-organisation of delivery and pick-up routes (64 per cent) • Adoption or improvement of nominated delivery day scheme for specific geographical areas:56 per cent) • Efforts to reduce drivers' waiting time at depots (38 per cent) • Fitting vehicles with airshields or governors to improve fuel economy (50 per cent) • Using more specialised vehicles, with the trend towards larger ones (39 per cent) • More aggressive rate negotiation with hired outwide transport contractors (51 per cent) • Using a more cost-effective transport mode mix such as changing from rail to road (38 per cent) • Different warehouse storage and handling system such as using fully or partially automated warehouses (48 per cent) • New methods and procedures in the warehouse (39 per cent) • Geographical relocation of warehouses and depots (39 per cent) • Improving staff productivity via incentive schemes (34 per cent) Other less commonly used techniques included unitisation of loads, denser packages to save volume capacity on vehicles and lowering the delivery frequency to customers.
Far fewer companies had attempted to improve productivity in the two more minor physical distribution areas, administration and inventory and production planning. For those who did, the gains in productivity were seven per cent and five per cent respectively.
While production planning was at quite a high level of sophistication the survey revealed that purchasing operations were not so well monitored and 40 per cent of the companies had no real measure of the reliability with which supplies arrived.
About half of the companies had tackled customer service as a means of increasing productivity.
Distribution management aimed at productivity was generally at quite an advanced level. But of the companies that had started to improve their productivity, 62 per cent had launched management training and educational programmes. Also 45 per cent had established management performance targets, 38 per cent tried better information systems and 18 per cent made organisational changes.
Finally, the survey asked what factors might stop or deter them from implementing productivity schemes. Top of list and mentioned by 66 per cent was lack of control over outside activities such as suppliers or customers. Other reasons mentioned included a lack of data, lack of standards by which to compare and internal demarcation problems.
So what conclusions can be drawn from the survey and what use is it? One of the biggest barriers to improving productivity is getting people to recognise it and realise that it means more than just how hard the drivers work. The survey showed this quite clearly; few companies had thought of productivity applying to all the various functions of their physical distribution operation.
But once the companies caught that "productivity fever" they found more and more ways to further improve their productivity.
Even if the survey only stimulates companies to examine their physical distribution operation it will achieve something; once they start searching for better productivity they will find Responding to this, the Centre for Physical Distribution Management is running a halfday executive briefing on Monday July 14 in Birmingham and on Monday July 21 in London. The subject matter is improving physical distribution productivity. Details are available from the CPDM, Management House, Parker Street, London WC2 5PT.
Putting a figure on potential savings in physical distribution through improving productivity, Kearney estimates that £2000 million savings are possible per year — a result of an overall 10 per cent increase in pd producitivty. Although this sounds an immense amount of money it doesn't necessarily mean that the United Kingdom is doing that badly at the moment. The survey did point out that in the area of production planning UK companies are generally more advanced than our American competitors.
Copies of the UK survey 48page report are available at £6 each from the Centre for Physical Distribution Management at the above address.