


CHART ATTAC
Page 36
Page 37
If you've noticed an error in this article please click here to report it so we can fix it.
• At the end of last year, Commercial Motor stirred up a hornets nest by reporting that tachograph charts give readings which are frequently 15 minutes inaccurate.
Drivers wrote in asking for more background evidence to help them fight hours cases being taken out against them. A leading chart manufacturer protested that its charts were 100% accurate and that the problem is entirely caused by hamfisted drivers forcing the charts over tachograph recording heads incorrectly.
But the Department of Transport stuck to its guns. Charts read by traffic examiners were frequently inaccurate, it said, and its Eastern Traffic Area office confirmed that its inspectors kept a wary eye out for the problem which was worse than we thought: some charts could be out by 30 minutes. The most likely cause is badly punched centre holes on the charts, meaning that the start of a driver's daily trace does not align properly with the start time. Many start and finish lines are being inaccurately recorded and drivers are being suspected of hours and daily rest infringements when they are innocent. So how are those charts produced. What sort of production checks do the manufacturers carry out to ensure accuracy? And what is the root cause of the problem?
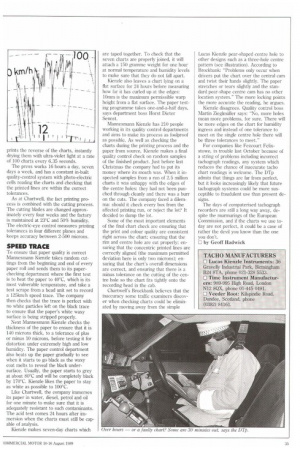
The two leading suppliers of tachograph charts in the UK are Mannesmann Kienzle of West Germany, which produces charts for the Lucas Kienzle range of tachograph recorders, and Chartwell, an independent specialist printing company from west London which manufactures tacho charts for Lucas Kienzle, Veeder Root and Jaeger units. Badly produced chart paper flakes and distorts the tachograph trace reading, like the example above. The clear trace (above right) is made on approved-quality paper.
Chartwell entered the business in 1975 and took several years to tool up and achieve type approval before it started manufacturing charts for Veeder Root in 1977, ahead of the compulsory tachograph legislation which arrived in the early 1980s. According to Chartwell's managing director Bob Brockbank, Chartwell was already well known for its precision graph paper printing process, and tachograph charts seemed a logical expansion. Besides, he says: "I could feel that significant business was looming."
Chartwell prints on BSI-approved waxed paper with a 500-micron tolerance on the printed line. The paper has to withstand immersion in oil, water, petrol and diesel without distorting, and it has to withstand severe temperature changes on the basis that trucks operature anywhere on earth, from inside the artic circle to the Sahara desert, to tropical rain forests.
MINUS TOLERANCE
Chartwell first prints the reverse of the charts and then cuts and prints the face (recording side) simultaneously. "We cut and print in a single precision process," says Brockbank, "with a plus or minus tolerance of 100 microns. You have to keep to a plus or a minus tolerance of 500 microns to stay within the regulations."
Chartwell is in the process of installing new presses which print both sides of the chart and cut them in a single operation. When each new print run is set up Chartwell checks at least one chart from every 2,000 printed before moving to one in every 10,000 printed.
At Mannesmann Kienzie's factory in Villingen, the company prints and produces all of its charts on one machine, using two types of paper; one for automatic chart analysis use and one for normal analysis. Most of the paper is supplied direct from Ferd Rileschag of Switzerland on giant rolls and is first checked for tension. A large single Gallus R250B printing press prints the reverse of the charts, instantly drying them with ultra-violet light at a rate of 100 charts every 6.35 seconds.
The press works 16 hours a day, seven days a week, and has a constant in-built quality-control system with photo-electric cells reading the charts and checking that the printed lines are within the correct tolerances.
As at Chartwell, the fact printing process is combined with the cutting process. The cutting blades are changed approximately every four weeks and the factory is maintained at 23°C and 50% humidity. The electric-eye control measures printing tolerances in four different planes and keeps accuracy between 2-500 microns.
SPEED TRACE
Tu ensure that paper quality is correct Mannesmann Kienzle takes random cuttings from the beginning and end of every paper roll and sends them to its paperchecking department where the first test is to heat the paper to 40°C, which is its most vulnerable temperature, and take a test scrape from a head unit set to record a 125kmih speed trace. The company then checks that the trace is perfect with no white particles left on the black trace to ensure that the paper's white waxy surface is being stripped properly.
Next Mannesmann Kienzle checks the thickness of the paper to ensure that it is 140 microns thick, to a tolerance of plus or minus 10 microns, before testing it for distortion under extremely high and low humidity. The paper control department also heats up the paper gradually to see when it starts to go black as the waxy coat melts to reveal the black undersurface. Usually, the paper starts to grey at about 80°C and will be completely black by 170°C. Kienzle likes the paper to stay as white as possible to 100°C.
Like Chartwell, the company immerses its paper in water, diesel, petrol and oil for one minute to make sure that it is adequately resistant to such contaminants. The acid test comes 24 hours after immersion when the charts must still be capable of analysis.
Kienzle makes seven-day charts which are taped together. To check that the seven charts are properly joined, it will attach a 150 gramme weight for one hour at normal temperature and humidity levels to make sure that they do not fall apart.
Kienzle also leaves a chart lying on a flat surface for 24 hours before measuring how far it has curled up at the edges: lOmm is the maximum permissible warp height from a flat surface. The paper testing programme takes one-and-a-half days, says department boss Horst Dieter Sennst.
Mannesmann Kienzle has 210 people working in its quality control departments and aims to make its process as foolproof as possible. As well as checking the charts during the printing process and the paper from source, Kienzle makes a final quality control check on random samples of the finished product. Just before last Christmas the company had to put its money where its mouth was. When it inspected samples from a run of 2.5 million charts it was unhappy with the edges of the centre holes: they had not been punched through cleanly and there was a burr on the cuts. The company faced a dilemma: should it check every box from the affected printing run, or reject the lot? It decided to dump the lot.
Some of the most important elements of the final chart check are ensuring that the print and colour quality are consistent right across the chart; ensuring that the rim and centre hole are cut properly: ensuring that the concentric printed lines are correctly aligned (the maximum permitted deviation here is only two microns); ensuring that the chart's overall dimensions are correct, and ensuring that there is a minus tolerance on the cutting of the centre hole so the chart fits tightly onto the recording head in the cab.
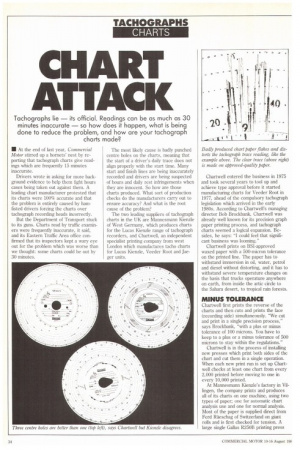
Chartwell's Brockbank believes that the inaccuracy some traffic examiners discover when checking charts could be eliminated by moving away from the simple Lucas Kienzle pear-shaped centre hole to other designs such as a three-hole centre pattern (see illustration). According to Brockbank: "Problems only occur when drivers put the chart over the central cam and twist their hands slightly. The paper stretches or tears slightly and the standard pear-shape centre cam has no other location system." The more locking points the more accurate the reading, he argues.
Kienzle disagrees. Quality control boss Martin Zieglmiiller says: "No, more holes mean more problems, for sure. There will be more edges on the chart for humidity ingress and instead of one tolerance to meet on the single centre hole there will be three tolerances to meet."
For companies like Fezcourt Felixstowe, in trouble last October because of a string of problems including incorrect tachograph readings, any system which reduces the chance of inaccurate tacho chart readings is welcome. The DTp admits that things are far from perfect, but it looks increasingly likely that future tachograph systems could be more susceptible to fraudulent use than present designs.
The days of computerised tachograph recorders are still a long way away, despite the murmurings of the European Commission, and if the charts we use today are not perfect, it could be a case of rather the devil you know than the one you don't.
by Geoff Hadwick