 1
1 2
2 3
3 4
4 5
5 6
6 7
7 8
8 9
9 10
10 11
11 12
12 13
13 14
14 15
15 16
16 17
17 18
18 19
19 20
20 21
21 22
22 23
23 24
24 25
25 26
26 27
27 28
28 29
29 30
30 31
31 32
32 33
33 34
34 35
35 36
36 37
37 38
38 39
39 40
40 41
41 42
42 43
43 44
44 45
45 46
46 47
47 48
48 49
49 50
50 51
51 52
52 53
53 54
54 55
55 56
56 57
57 58
58 59
59 60
60 61
61 62
62 63
63 64
64 65
65 66
66 67
67 68
68 69
69 70
70 71
71 72
72 73
73 74
74 75
75 76
76 77
77 78
78 79
79 80
80 81
81 82
82 83
83 84
84 85
85 86
86 87
87 88
88 89
89 90
90 91
91 92
92 93
93 94
94 95
95 96
96 97
97 98
98 99
99 100
100 101
101 102
102 103
103 104
104 105
105 106
106 107
107 108
108 109
109 110
110 111
111 112
112 113
113 114
114 115
115 116
116 117
117 118
118 119
119 120
120 121
121 122
122 123
123 124
124 125
125 126
126 127
127 128
128 129
129 130
130 131
131 132
132 133
133 134
134 135
135 136
136 137
137 138
138 139
139 140
140 141
141 142
142 143
143 144
144 145
145 146
146 147
147 148
148 149
149 150
150 151
151 152
152 153
153 154
154 155
155 156
156 157
157 158
158 159
159 160
160 161
161 162
162 163
163 164
164 165
165 166
166 167
167 168
168 169
169 170
170 171
171 172
172 173
173 174
174 175
175 176
176 177
177 178
178 179
179 180
180 181
181 182
182 183
183 184
184 185
185 186
186 187
187 188
188 189
189 190
190 191
191 192
192 193
193 194
194 195
195 196
196 197
197 198
198 199
199 200
200 201
201 202
202 203
203 204
204 COMMERCIAL VEHICLE STATISTICS.
Page 80
Page 81
If you've noticed an error in this article please click here to report it so we can fix it.
A Series of Informative Tables and Charts to Illustrate Them.
THERE has always been the need for somebody to sit down and get together statistics concerning the motor industry. -The volume of information has been vast, but extremely scattered, and it has not been worth the while of anybody engaged in the manufacturing or transport inch'stries to devote the time to garnering the facts and collating them.
However, thanks to the initiative of Colonel Hacking, the Trade Information Department of the Society of Motor Manufacturers and Traders has now produced its first volume of facts and figures in connection with the motor industry of Great Britain. It is based on productions of a similar type which Americans have seemed to have had the time and energy to prepare and issue, and as a first publication it is highly to be commended.
Briefly, its contents cover, in Part 1, the consumption of motor vehicles, rubber, tyres and motor spirit for a series of years, the large subject of roads, tip expenditure upon them and the revenue from motor taxation, accidents, imports and import duties, whilst there are some useful tables and charts showing the relationship between mechanical road transport and the railways.
Part 2 is devoted to British motor production, the table of the output of motor vehicles from the year 1007 to the year 1925 being based on partial information, but to be improved upon later when the census of production is prepare& Employment and wages, the trend of prices, the finance of the industry and a list of British motor standards come under this heading.
Part 3 deal with British motor exports, showing also world consumption of motor vehicles, and the information given in this part is rendered more valuable by reason of the detailed attention given to individual markets.
The customs tariffs of the world are brought in under Part 4.
In the appendix is given information concerning the organization of the Society and the motor organizations at home and overseas, whilst the index of the volume has been skilfully prepared.
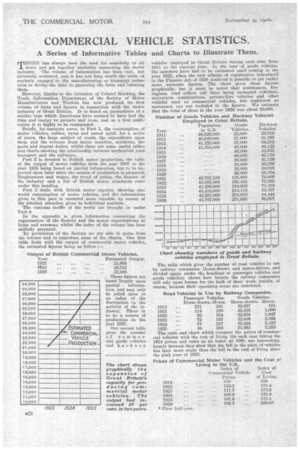
By permission .of the Society we are able to quote from the volume and to reproduce some of the charts. Our first table deals with the output of commercial motor vehicles, the estimated figures being as follow :
vehicles employed in Great Britain during each year from 1911 to the current year. In the case of goods vehicles, the numbers have had to be estimated until coming to the year 1922, when the new scheme of registration introduced in the Finance Act of 1920 rendered it possible to get rather more accurate figures. The chart gives these figures graphically, but it must be noted that ambulances, fireengines, road rollers (all three being -exempted vehicles), motorcycle combinations, private-hire vehicles and other vehicles used as commercial vehicles, but registered as motorcars, are not included in the figures. We estimate that the total of these in the year 1926 was about 30,000.
Number of Goods Vehicles and Hackney Vehicles Employed in Great Britain. Population Goods Hackney Year. in GB. Vehicles. Vehicles. 1911 40,529,000 25,000 28,918 1912 40,940,00C 31.000 31,260 1913 41,123,000 37,000 34,212 1914 41,334,000 47,000 46,122 1915 -49,000 38,951
1916 _ .. _ 49,000 45,170
1917 39,000 41,759 1918 28,000 36,399 1919 88,000 38,619 1920 66,000 65,894 1921 42,767,530 135,000 70,000 1922 43,075,000 162,425 72,263 1923 43,299,000 184,636 78,358 1.924 43,416,000 • 213,113 83,527 1925 43,597,000 234,970 84,444 1926 43,767,000 251,685 99,077 Chart showing numbers of goods and hackney vehicles employed in Great Britain.
The table which gives the number of road vehicles in use by railway companies (horse-drawn and motor-driven, and divided again under the headings of passenger vehicles and goods vehicles) shows how largely the railway companies still rely upon horses for the bulk of their work, mainly, of course, because their operating areas are restricted.
Road Vehicles in Use by Railway Companies.
Passenger Vehicles. Goods Vehicles. Horse drawn. Motor. Horse drawn. Motor.
,1913 ... 231 241 32,657 191 1921 114 , 150 . 33,425 1,690
1922 ... 92 . 154 32,658 1,947
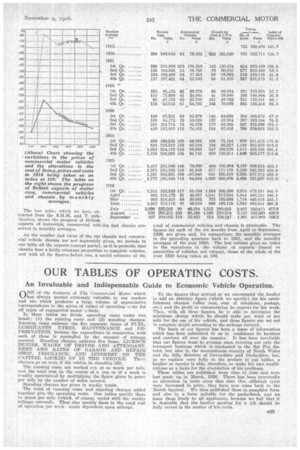
1923 ... 72 187 32,639 2,099 1924 ... 57 217 32,424 2,122 1925 ... 38. 303 31,663 2,282 The table and chart which compare the prices of commercial vehicles with the cost of living (in each case taking the 1914 prices and costs as an index at 100) are interesting, largely because they show that the fall in the price of vehicles has been more acute than the fall in the cost of living since the peak year of 1922.
Prices of Commercial Motor Vehicles and the Cost of Living in the U.K. Index of Index of Commercial Vehicle Cost Prices. of Living. As the number and value of the car chassis and commercial vehicle chassis are not separately given, we include in our table all the exports (except parts), as it is probable that chassis bear a fairly constant proportion to complete vehicles, and with all the figures before one, a useful estimate of the total of commercial vehicles and chassis is attainable. The figures for each of the six months from April to September, 1926, are given and, for comparison, the monthly averages in the preceding quarters back to 1921, and the monthly averages of the year 1920. The last column gives an index to the variations in the volume of exports' (based on quantities of vehicles, not values), those of the whole of the year 1923 being taken at 100.