


Fifty Years of Costs
Page 71
Page 75
If you've noticed an error in this article please click here to report it so we can fix it.
The New Edition of" The Commercial Motor" Tables of Operating Costs Makes Allowance for Several Increases in Users' Expenditure
COMPREHENSIVE tables of operating costs first appeared in The Commercial Motor in 1911. The new
, issue of the Tables, published on July 5, price 3s. 6d. (4s. Postage paid). is therefore a Jubilee Edition.
During these 50 years the road transport industry has experienced many changes and vast expansion. Concurrently, there has been a revolution in the relative values of goods and services. Successive editions of the Tables have incorporated the effects of these changes on the cost of operating commercial vehicles, but the underlying principles have remained the same. Compared with the Tables published last year, this new edition makes allowance for the alterations in motor vehicle duties announced in the Budget on April 17, 1961. In addition to the resulting higher cost of licences, the other four items of standing costs, namely wages, rent and rates, insurance and interest, have all had to be appreciably increased.
Relative to goods vehicle operation, drivers' wages arc based on the minimum rates of remuneration as set out in the current Road Haulage Wages Order R.H.(70), as applicable to vehicles based in the intermediate—Grade I---areas. Whilst there is a statutory obligation on Aand B-licence operators to pay such rates, these are not binding on users of C-licence vehicles. In practice, however, the rate of wages actually paid by ancillary users does not differ substantially.
Correspondingly. the wages paid to drivers of passenger vehicles have been calculated in this new edition of the Tables on the basis of the most recent and relevant national scales.
In both eases additions to the basic minimum remuneration have been made in respect of the amounts which employers contribute to both the new Graduated Pension and National Insurance, and voluntary employers' indemnity insurance. Whilst no longer obligatory, these latter payments replace contributions necessary under the former Workmen's Compensation Act. An appropriate adjustment is also made to both goods and passenger wages to include the cost of holidays with pay.
Increases in the cost of garaging vehicles have also been allowed for in this new edition by the addition of approximately 10 per cent. to the item of rent and rates.
A substantial change has been made in the basis for calculating the cost of insuring goods vehicle operation. Because of the increasing disparity between the amount of premium paid by hauliers or ancillary users, the following compromise has been introduced in this new edition so as to avoid undue complication. _
THE cost of insuring goods vehicles with a carrying capacity of under 3 tons, as listed in Tables One and Four, continues to be based on the average amount of premium likely to be paid for comprehensive cover on a C-licensed vehicle operating in medium-risk areas. Above that carrying capacity, the amount of premium appropriate to A-licence operation is used to form the basis in calculating the cost of insuring vehicles listed in Tables Two, Three, Five and Six.
It is emphasized that in all cases the cost of insurance as shown in the Tables refers solely to premiums paid in respect of the vehicle. The actual amount payable by individual operators will, of course, vary widely according to the area of location, type of operation. capacity and value of vehicle, the extent of cover required and the accident records of individual operators, to which insurers are giving increasing attention.
Because of the higher rates of interest being paid on capital investment generally, this item of standing cost is now calculated on a basis of a rate of 5 per cent, per annum on the initial outlay of each vehicle.
Expenditure on fuel is a substantial proportion of the total cost of operating a commercial vehicle. It is therefore particularly important that this item should be as accurately estimated and subsequently recorded as possible. Unfortunately, however, there is a wide range of prices at which fuel can be purchased, and for complete accuracy any estimate of operating costs shoula include calculations based on the exact amount paid for fuel by the operator concerned. For the purpose of the costs shown in this new edition of the Tables, the price paid for petrol is reckoned at 3s. I0d. per gallon for commercial vehicles and 4s. 70. for the cars listed in Table Nine. Oil fuel (derv) is reckoned to cost 3s. 10fd. per gallon. It is assumed that the price of standard-grade petrol purchased in an inner zone is applicable to commercial vehicles, and that operators take advantage of bulk delivery.
Individual operators will, however, purchase fuel at various prices due to the combined effect of price zoning and bulk, fleet or, agency discounts. To facilitate variations in this important item of operating cost, a ready-reckoner is included in the Tables from which the fuel cost per mile resulting from variations in both price per gallon and rate of consumption can be readily obtained and substituted for the cost shown in the Tables where appropriate.
THE cost of lubricants remains substantially the same and is intended to allow for both engine oil consumption and sump replacement.
Tyre costs per mile are obtained by dividing the price of a set of tyres specified as standard equipment (excluding the spare) by the estimated mileage life per set appropriate to the particular type of vehicle, under average operating conditions.
As in previous editions, the cost of maintenance as shown in the Tables is intended to cover all work necessary to keep vehicles in a clean, efficient and roadworthy condition. Because washing and light servicing are often performed periodically, for example, weekly, irrespective of variations in weekly mileage, total maintenance cost will not necessarily be directly relative to mileage. As with tyres, the maintenance costs shown represent average figures of users operating standard vehicles under normal conditions. Incidentally, in respect of goods vehicles, it is assumed that standard platform bodies are fitted for vehicles other than those shown in Table One.
Depreciation continues to be calculated on a mileage basis and the estimated life ranges from 75,000 miles for the smallest vehicle to 300,000 miles for the largest. The depreciation cost per mile is obtained by first deducting the equivalent price of the original set of tyres from the initial cost of the vehicle. followed by a further deduction in respect of the estimated residual value. Because of fluctuations in the resale market for commercial vehicles in recent months, these residual amount values are now assessed at 10 per cent. of the initial cost. The remaining balance is then divided by the figure of estimated mileage life appropriate to the particular vehicle, whilst an adjustment is also made, when necessary, to allow for obsolescence resulting from exceptionally low annual mileage or special conditions of operation.
The total operating cost is then obtained by the addition of the five items of both standing and running costs. Because operating costs vary according to mileages run, these are given for a range of average weekly mileages appropriate to the types of vehicle listed in each of the nine Tables. Thus. in Table One—Goods Vehicles (Rigids), 5 cwt. to 2 tons—the weekly mileages range from 100 to 500. which are considered appropriate to retail distribution and similar work. In Table Three—Goods Vehicles (Rigids). 8 tons to 16 tons—the corresponding range is from 400 to 1,200. as would be operated by vehicles engaged on mediumand long-distance journeys.
Operating costs per mile and per week are given and both are applicable for use by hauliers and ancillary users, after
appropriate adjustment of insurance costs when necessary. Alternatively, total operating costs can be calculated by the user of the Tables for any period or journey by adding the running cost appropriate to the mileage incurred to the relative cost of the total time involved, which should include both travelling and standing time. To facilitate such calculations, standing costs per hour and per week are shown in the Tables.
Overhead or establishment costs consist of all items of expenditure which cannot be accounted directly to specific vehicles when more than one is operated. Such costs include expenses which can be grouped under the headings of management, office, garage and stores, warehouse, branch depots, sales and publicity, professional services and auxiliary fleet. For the purpose of the Tables, the allocation of establishment costs bears 'relation, but is not directly proportional, to carrying capacity and is assessed at 20 per cent. of the total operating cost.
Profit margin is intended as an element of cost to cover the risk inevitable in running a business in contrast to the comparative security of paid employment. This is also assessed at 20 per cent. of the total operating cost.
THE minimum charges shown in the Tables result from the addition of the total operating cost, establishment costs and profit margin. Corresponding to the variation in operating costs, a range of 'differing charges is shown applicable to appropriate mileages, and for this reason no standard charge can be given.
In addition to detailing the minimum charges per mile and per week, provision is made for users of the Tables to calculate charges on a time plus mileage basis by including the relative charges per hour and per mile.
The whole of the foregoing comments refer to commercial vehicles with petrol or oil engines. Because of the special circumstances, different methods of calculating costs are adopted when dealing with electric vehicles (Table Four) and cars (Table Nine). Because the maintenance of electric vehicles is frequently scheduled on a time rather than mikage basis, this item is shown as a standing cost. Depreciation is similarly allocated and divided into three sub-items appropriate to this etas; of vehicle with varying rates of depreciation of chassis, body, battery and charger. The cost of electric current is reckoned at Id. per B.Th.U.
Depreciation is also calculated on a time basis in Table Nine. This is in conformity with the increasing tendency for frequent replacement of cars provided for business purposes. For the purpose of this Table it is assumed that a policy of annual
replacement is adopted to achieve maximum availability and avoid otherwise complex problems of maintaining scattered fleets of staff cars.
As with commercial vehicles, an adjustment has been made in the allowance for residual value as a result of fluctuations in the used car market Over the past year, which now range from 171 to 25 per cent, of the initial cost.
Resulting from a policy of annual replacement, the two items of running costs-maintenance and tyres-shown in Table Nine are not comparable with the corresponding items relative to commercial vehicles. It has been assumed that, when cars are changed annually, the maintenance necessary during the first 12 months of their life will be limited to tasks included in manufacturers' servicing schemes, and the resulting cost has been calculated accordingly. Similarly, it is assumed that when cars are replaced at the end of the year they will still be fitted with the original set of tyres. The tyre costs shown in Table Nine are therefore intended to cover only accidental damage.
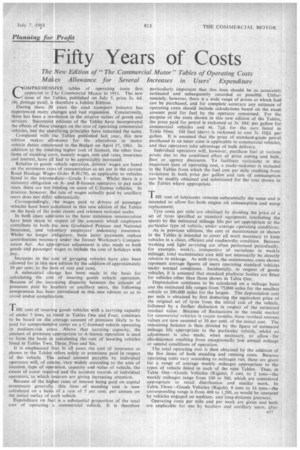
With the announcement of the publication of this Jubilee Edition of the Tables, the opportunity is taken to reproduce (Fig. 1) an extract of estimated Working Costs for Motor Vehicles which appeared in The Commercial Motor on February 16, 1911. The vehicles shown include both petrol and steam-engined types.
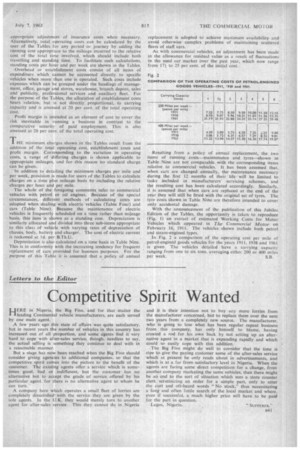
In Fig. 2 a comparison of the operating cost per mile of petrol-engined goods vehicles for the years 1911, 1938 and 1961 is given. The vehicles detailed have a carrying capacity ranging from one to six tons, averaging either 200 or 400 miles per week. S.B.