


'Most companies have the data and the capability to analyse it'
Page 43
If you've noticed an error in this article please click here to report it so we can fix it.
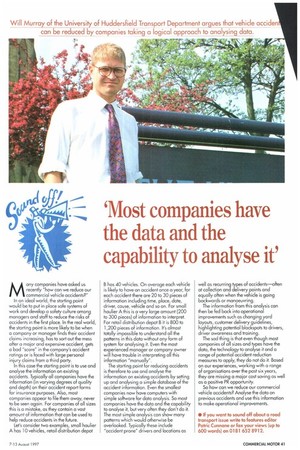
Will Murray of the University of Huddersfield Transport Department argues that vehicle acciden can be reduced by companies taking a logical approach to analysing data.
Many companies have asked us recently "how can we reduce our commercial vehicle accidents?" In an ideal world, the starting point would be to put in place safe systems of work and develop a safetv culture among managers and staff to re8uce the risks of accidents in the first place. In the real world, the starting point is more likely to be when a company or manager finds their accident claims increasing, has to sort out the mess after a major and expensive accident, gets a bad "score" in the company's accident ratings or is faced with large personal injury claims from a third party.
In this case the starting point is to use and analyse the information on existing accidents. Typically all companies have the information (in varying degrees of quality and depth) on their accident report forms for insurance purposes. Also, most companies appear to file them away, never to be seen again. For companies of all sizes this is a mistake, as they contain a vast amount of information that can be used to help reduce accidents in the future. Let's consider two examples, small haulier A has 10 vehicles, retail distribution depot B has 40 vehicles. On average each vehicle is likely to have an accident once a year, for each accident there are 20 to 30 pieces of information including time, place, date, driver, cause, vehicle and so on. For small haulier A this is a very large amount (200 to 300 pieces) of information to interpret. For retail distribution depot B it is 800 to 1,200 pieces of information. It's almost totally impossible to understand all the patterns in this data without any form of system for analysing it. Even the most experienced manager or company owner will have trouble in interpreting all this information "manually".
The starting point for reducing accidents is therefore to use and analyse the information on existing accidents by setting up and analysing a simple database of the accident information. Even the smallest companies now have computers with simple software for data analysis. So most companies have the data and the capability to analyse it, but very often they don't do it. The most simple analysis can show many patterns which would otherwise be overlooked. Typically these include "accident prone" drivers and locations as well as recurring types of accidents—often at collection and delivery points and equally often when the vehicle is going backwards or manoeuvring. The information from this analysis can then be fed back into operational improvements such as changing yard layouts, customer delivery guidelines, highlighting potential blackspots to drivers, driver awareness and training.
The sad thing is that even though most companies of all sizes and types have the data, the technology to analyse it and a range of potential accident reduction measures to apply, they do not do it. Based on our experiences, working with a range of organisations over the past six years, they are missing a major cost saving as well as a positive PR opportunity. So how can we reduce our commercial vehicle accidents? Analyse the data on previous accidents and use this information to make operational improvements.
• If you want to sound off about a road transport issue write to features editor Patric Cunnane or fax your views (up to 600 words) on 0181 652 8912.