


When changes have been made to the data, it is
Page 38

Page 39
If you've noticed an error in this article please click here to report it so we can fix it.
easy to freeze a copy that can be run later – this is useful for running a number of ‘what if’ scenarios to ind a best solution. It is also possible to maintain a Master File of data – such as regular stops – and add orders daily.
The Stop ile looks straightforward, but it is lexible: for instance, you can set up to 10 time windows for each record and there is a choice of day numbering systems (either relative, such as ‘two days from now’, or in terms of days of the week or calendar days). The system will also work with location data from any X-Y (or latitude/ longitude) grid.
Each stop record can have up to 15 quantity ields (using any units, for instance, pallets, cages, kg, metres) and these quantities can be positive or negative – to allow for loading as well as unloading. They can also be associated with a ixed stop time and a loading or unloading rate, to determine the length of a particular stop.
Another part of each stop record is the use of Special Codes – and these are the key to tailoring TruckStops to a particular operation. Special codes can be used to add speciic delivery requirements – for instance, to match a load against a particular vehicle type or set a particular route order (vital for operations such as milk collection).
You can also use a hierarchy of priority lags to select available orders according to their urgency and importance: the system loads these into the schedule in line with the stated priorities. It then adds non-prioritised orders to make best use of remaining resources; any remaining orders not included in the current schedule can have their priority levels increased for the following plan.
The Truck ile is a set of Truck records – all the usual ields for capacity, speed and time availability are here, as well as driver constraints (hours rules, etc) and the costs associated with different activities. These records can represent any resource available to undertake a task: one could represent a third party (eg a pallet network or courier), giving the system the option of using that resource for a particularly out-of-the-way delivery. In a debt-collection application, it might represent a particular bailiff.
Again, special codes can be used and you can add differentials to speed up the unloading rate for a vehicle with a side curtain, for instance. Also, the start and end points for a vehicle can be different. “It is inherently a multi-depot system,” says Short.
Running a schedule
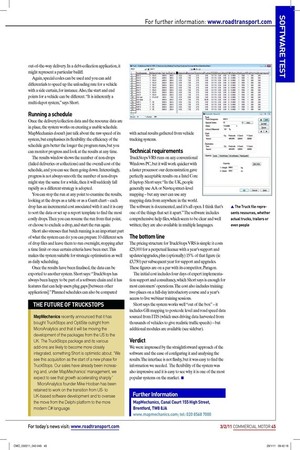
Once the delivery/collection data and the resource data are in place, the system works on creating a usable schedule. MapMechanics doesn’t just talk about the raw speed of its system, but emphasises its lexibility: the eficiency of the schedule gets better the longer the program runs, but you can monitor progress and look at the results at any time.
The results window shows the number of non-drops (failed deliveries or collections) and the overall cost of the schedule, and you can see them going down. Interestingly, progress is not always smooth: the number of non-drops might stay the same for a while, then it will suddenly fall rapidly as a different strategy is adopted.
You can stop the run at any point to examine the results, looking at the drops as a table or as a Gantt chart – each drop has an incremental cost associated with it and it is easy to sort the data or set up a report template to ind the most costly drops. Then you can resume the run from that point, or choose to exclude a drop, and start the run again.
Short also stresses that batch running is an important part of what the system can do: you can prepare 10 different sets of drop iles and leave them to run overnight, stopping after a time limit or once certain criteria have been met. This makes the system suitable for strategic optimisation as well as daily scheduling.
Once the results have been inalised, the data can be exported to another system. Short says: “TruckStops has always been happy to be part of a software chain and it has features that can help users plug gaps [between other applications].” Planned schedules can also be compared with actual results gathered from vehicle tracking systems.
Technical requirements
TruckStops VRS runs on any conventional Windows PC, but it will work quicker with a faster processor: our demonstration gave perfectly acceptable results on a Intel Core i5 laptop. Short says: “In the UK, people generally use AA or Navteq street-level mapping – but any user can use any mapping data from anywhere in the world.
The software is documented, and it’s all open. I think that’s one of the things that set it apart.” The software includes comprehensive help iles, which seem to be clear and well written; they are also available in multiple languages.
The bottom line
The pricing structure for TruckStops VRS is simple: it costs £25,000 for a perpetual licence with a year’s support and updates/upgrades, plus (optionally) 15% of that igure (ie £3,750) per subsequent year for support and upgrades. These igures are on a par with its competitor, Paragon.
The initial cost includes four days of expert implementation support and consultancy, which Short says is enough for most customers’ operations. The cost also includes training: two places on a full-day introductory course and a year’s access to live webinar training sessions.
Short says the system works well “out of the box” – it includes GB mapping to postcode level and road speed data sourced from ITIS (which uses driving data harvested from thousands of vehicles to give realistic trafic speeds) – but additional modules are available (see sidebar).
Verdict
We were impressed by the straightforward approach of the software and the ease of coniguring it and analysing the results. The interface is not lashy, but it was easy to ind the information we needed. The lexibility of the system was also impressive and it is easy to see why it is one of the most popular systems on the market. ■