


Ideology of transmission matching
Page 45
Page 47
If you've noticed an error in this article please click here to report it so we can fix it.
WHEN a 16-ton-gross platform vehicle with a power-to-weight ratio of around 11 bhp /ton laden is operating in the 30/55 mith speed range without a load on a! level road in still air, its specific fuel consumption is typically some 20 per cent higher than that of the same vehicle carrying a loaded container. And the engine rpm of the unladen vehicle is up to double the speed at which the engine would develop the required power if it operated at its minimum fuel consumption.
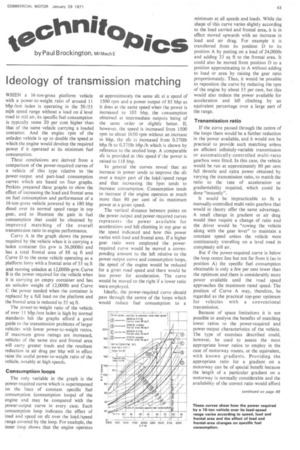
These conclusions are derived from a comparison of the power-required curves of a vehicle of this type relative to The power-output and part-load consumption curves which are based on four graphs. Perkins prepared these graphs to show the effect of increasing the load and frontal area on fuel consumption and performance of a 16-ton-gross vehicle powered by a 180 bhp diesel over its normal speed range in top gear, and to illustrate the gain in fuel consumption that could be obtained by improved matching of the overall transmission ratio to engine performance.
Curve A in the graph shows the power required by the vehicle when it is carrying a laden container (its gvw is 36,0001b) and has a total frontal area of 88 sq ft and Curve D to the same vehicle operating as a platform lorry with a frontal area of 55 sq ft and running unladen at 12,000lb gvw.Curve B is the power required for the vehicle when it is carrying an empty container and has an unladen weight of 12,000lb and Curve C the power needed when the container is replaced by a full load on the platform and the frontal area is reduced to 55 sq ft.
The power-to-weight ratio of the vehicle of over 11 bhp /ton laden is high by normal standards bat the graphs afford a good guide to the transmission problems of larger vehicles with lower power-to-weight ratios. If maximum gross ratings are increased, vehicles of the same size and frontal area will carry greater loads and the resultant reduction in air drag per bhp will in effect raise the useful power-to-weight ratio of the vehicle, notably at high speeds.
Consumption loops
The only variable in the graph is the power-required curve which is superimposed on the lines of constant specific fuel consumption (consumption loops) of the engine and may be compared with the power-output curve in every case. Each consumption loop indicates the effect of load and speed on sfc over the load/speed range covered by the loop. For exainple, the inner loop shows that the engine operates
at approximately the same sfc at a speed of 1500 rpm and a power output of 85 bhp as it does at the same speed when the power is increased to 103 bhp, the consumption obtained at intermediate outputs being of the same order or slightly better. If, however, the speed is increased from 1500 rpm to about 1650 rpm without an increase in bhp, the sfc is increased from 0.370Ib bhp /h to 0.3751b bhp /h which is shown by reference to the sectind loop. A comparable sfc is provided at this speed if the power is raised to 118 bhp.
In general the curves reveal that an increase in power tends to improve the sfc over a major part of the load /speed range and that increasing the i-pm tends to increase consumption. Consumption tends to increase if the engine operates at much more than 80 per cent of its maximum power at a given speed.
The vertical distance between points on the power-output and power-required curves represents the power available for acceleration and hill climbing in top gear at the speed indicated and how this power varies with load and frontal area. If a higher gear ratio were employed the powerrequired curve would be moved a corresponding amount to the left relative to the power-output curve and consumption loops, the speed of the engine would be reduced for a given road speed and there would be less power for acceleration. The curve would be moved to the right if a lower ratio were employed.
Ideally, the power-required curve should pass through the centre of the loops which would reduce fuel consumption to a minimum at all speeds and loads. While the shape of this curve varies slightly according to the load carried and frontal area, it is in effect moved upwards with an increase in load and air drag. For example it is transferred from its position D to its position A by putting on a load of 24,000lb and adding 33 sq ft to the frontal area. It could also be moved from position D to a position approximating to A without adding to load or area by raising the gear ratio proportionately. Thus, it would be possible to reposition the curve by reducing the rpm of the engine by about 55 per cent, but this would also reduce the power available for acceleration and hill climbing by an equivalent percentage over a large part of the range.
Transmission ratio
If the curve passed through the centre of the loops there would be a further reduction in the -power available, and it would not be practical to provide such matching unless an efficient infinitely-variable transmission or automatically-controlled multi-ratio gearbox were fitted. In this case, the vehicle would be run at approximately 80 per cent full throttle and extra power obtained by varying the transmission ratio, to match the ratio to the rate of acceleration or• gradientability required, which could be done "instantly".
It would be impracticable to fit a manually-controlled multi-ratio gearbox that would in theory offer the same advantage. A small change in gradient or air drag would then require a change of ratio and the driver would be "rowing the vehicle along with the gear lever" to maintain a constant speed unless the vehicle were continuously travelling on a level road in completely still air.
But if the power-required curve is below the loop centre line but not far from it (as in position A) the specific fuel consumption obtainable is only a few per cent lower than the optimum and there is considerably more power available until the road speed approaches the maximum rated speed. The position of Curve A may, therefore, be regarded as the practical top-gear optimum for vehicles with a conventional tran smission.
Because of space limitations it is not possible to analyse the benefits of matching lower ratios to the power-required and power-output characteristics of the vehicle. The type of exercises described could, however, be used to assess the most appropriate lower ratios to employ in the case of motorway routes, or the equivalent, with known gradients. Providing the appropriate ratio for a gradient on a motorway can be of special benefit because the length of a particulargradient on a motorway is normally considerable and the availability of the correct ratio would afford consumption and gradientability advantages over extended periods of running.
Data derived from the graphs show that the power absorbed by air drag when the vehicle is carrying a container is about 1.5 bhp /sq ft which compares with a drag of atiproximately 1 bhp /sq ft of a typical motorways coach fravelling at the same speed. And this gives -some idea of the potential of moderate streamlining.
It is appropriate to re-emphasize that streamlining (or reducing the frontal area) exacerbates the problem of providing a matching transmission ratio. According to reliable reports from operators, a vehicle carrying a van body or container often returns a fuel consumption that is comparable to that of an identical vehicle having a platform body. While the gain in specific fuel consumption resulting from the larger frontal area of the van body would only partly offset the increased consumption of the engine (in mpg) operating at the higher output required, it can be assumed that the average speed of the van would be reduced on faster routes. And this would be favourable to fuel economy.
A comparison of Curve C with Curve A shows the extra power required to overcome the air drag produced by the co.itainer. The maximum attainable road speed of the container-carrying vehicle is 55/56 mph for which the maximum output ot the engine of 180 bhp is required. At this speed the ppwer output of the engine of the platform vehicle is about 148 bhp, the reduction in power (resulting from the reduced air drag) required being 32 bhp.
If the container vehicle were designed to operate at a maximum speed of 60 mph engine power would have to be increased to about 210 bhp whereas the platform vehicle would have approximately 8 bhp in hand at this speed—a difference of 38 bhp. Equipping the platform vehicle with a higher ratio to give a matching comparable to that of the container vehicle would reduce fuel consumption by 4 per cent (0.39 lb bhp /11 to 0.375 lb blip /h) at a cruising speed 'of say 50 mph an it would provide a reduction in engine speed of some 250 rpm.
Curve B shows that the specific fuel consumption of the vehicle when it is carrying an unladen container at 50 mph is some 17 per cent greater than that of the laden vehicle. Transmission matching would reduce the speed by 625 rpm in addition to reducing fuel consumption.
Of necessity this assessment of the value of transmission matching is an over-simplification. Variations in engine characteristics that have to be taken into account include torque back-up as well as maximum speed. Transmission losses and tyre drag are also important variables; although they increase at a lower rate than air drag their sum is typically greater than air drag at speeds below about 55 mph. Air drag increases as the square of the speed. If speed is doubled air drag is increased four times.