


Transport Today in the U.S.A.
Page 51
If you've noticed an error in this article please click here to report it so we can fix it.
WHEN I ended last week's "Diary ", the subject was the Transportation Association of America. There is no equivalent to T.A.A. in this country. In fact, the only organization I can think of which embraces all modes of transport is the Institute of Transport—and I would not for a moment suggest that the I.o.T. is in any sense a political pressure group.
What particularly impressed me about T.A.A., as I said last week, was the volume of statistical material it produces with a comparatively small staff. Just one such example is a booklet " Transportation Facts and Trends ", which T.A.A. published while I was in the States. As such, it certainly provides the most up-to-date source available by which to judge the American national transport picture. These are, I suspect, therefore, the latest figures relating to the American transport scene to be published by any British journal. What, of course, emerges most noticeably is the decline of the railways in comparison with road and air transport.
Firstly, a few generalized figures. in 1962 Americans spent $112 billion either directly or indirectly on transportation. This represents approximately 20 per cent of the United States' total expenditure on goods and services. Nearly 18 per cent of all Federal taxes come from transport sources (including manufacturers of equipment). Some 14 per cent of total civilian employment is in transport or its related industries.
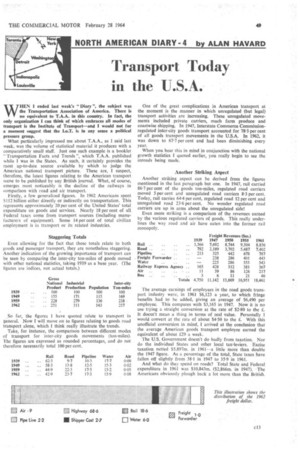
Even allowing for the fact that those totals relate to both goods and passenger transport, they are nonetheless staggering. Another indication of the growing importance of transport can be seen by comparing the inter-city ton-miles of goods moved with other national statistics, taking 1939 as a base year. (The figures are indices, not actual totals.)
So far, the figures I have quoted relate to transport in general. Now I will move on to figures relating to goods road transport alone, which I think really illustrate the trends.
Take, for instance, the comparison between different modes of transport for inter-city goods movements (ton-miles). The figures are expressed as rounded percentages, and do not therefore necessarily total 100 per cent.
One of the great complications in American transport at the moment is the manner in which unregulated (but legal) transport activities are increasing. These unregulated movements included private carriers, much farm produce and coastwise shipping. In 1947, Interstate Commerce Commissionregulated inter-city goods transport accounted for 78-3 per cent of all goods transport movements in the U.S.A. In 1962, it was down to 67.7 per cent and had been diminishing every year.
When you bear this in mind in conjunction with the national growth statistics I quoted earlier, you really begin to see the inroads being made.
Another Striking Aspect Another striking aspect can be derived from the figures mentioned in the last paragraph but one. In 1947, rail carried 86-7 per cent of the goods ton-miles, regulated road carriers moved 5 per cent and unregulated road carriers 8-3 per cent. Today, rail carries 64.4 per cent, regulated road 12 per cent and unregulated road 23-6 per cent. No wonder regulated road carriers are up in arms about the unregulated side/ Even more striking is a comparison of the revenues earned by the various regulated carriers of goods. This really underlines the way road and air have eaten into the former rail monopoly.
The average earnings of employees in the road goods transport industry were. in 1961 $6,123 a year, to which fringe benefits had to he added, giving an average of $6,490 per employee. This compares with $3,165 in 1947. Now it is no use trying a straight conversion at the rate of $2-80 to the £. It doesn't mean a thing in terms of real value. Personally I would convert at the rate of about $4.50 to the £. With this unofficial conversion in mind, I arrived at the conclusion that the average American goods transport employee earned the equivalent of about £29 a week.
The U.S. Government doesn't do badly from taxation. Nor do the individual States and other local tax-leviers. Excise taxation netted 55,897m. in 1961—a little more than double the 1947 figure. As a percentage of the total, State taxes have fallen off slightly from 38.1 in 1947 to 35-9 in 1961.
And what do they spend on roads? Total State and Federal expenditure in 1961 was $10,843m. (52,866m. in 1947). The Americans obviously plough back a lot more than the British.
a