


War-time Increases and The ct on To-day's
Page 22
Page 23
Page 24
If you've noticed an error in this article please click here to report it so we can fix it.
Many Operators, Now Turning from Minisi Customers to Commercial Buyers of Tram are Finding the Need to Justify Today's Here are Some Figures and Argument.
MY two previous articles were even more timely than I thought. Since writing them, but before their publication, I received a number of inquiries which confirm, I might even say emphasize, my feeling that the time is ripe for preparing to quote for ordinary peace-time haulage business. This article is devoted to an aspect of the matter raised by several of my correspondents; they desire to know what is"the percentage increase in costs since the commencement of the war.
Reading between the lines of some of these communications, it is obvious that the writers 'have been getting into touch again with their .pre-war customers and have already fallen foul of the rates problem.
One of the things which inclines one to that view is that, in almost every case, I am asked to quote percentage increases in costs and rates rather than, or in addition to, absolute figures for rates increases. The inference I draw is that their ofd customers are asking for justification of rates increases.
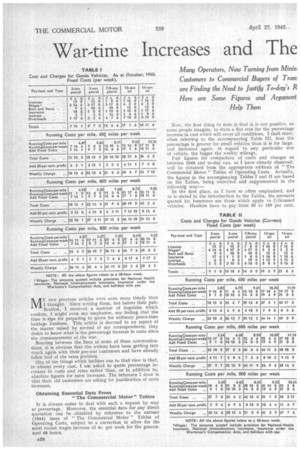
Obtaining Essential Data From • " The Commercial Motor" Tables It is always easier to deal with such a request by way of percentage. Moreover, the essential data for any direct quotation can be obtained by reference to the current (1944) issue of " The Commercial Motor" Tables of Operating Costs, subject to a correction to allow for the most recent wages increase of 4s. per week for the guaranteed 48 hours. Now, the first thing to note is that it is not possible, as some people imagine, to state a flat rate for the percentage increase in cost which will cover all conditions. I shall show, when referring to the accompanying Table III, that the percentage is greater for small vehicles than it is for large, and increased again, in regard to any particular size of vehicle, the bigger the weekly mileage.
Fair figures for comparison of costs and charges as between 1940 and to-day can, as I have already observed: well be obtained from the appropriate editions of "The Commercial Motor "Tables of Operating Costs, Actually, the figures in the accompanying Tables I and II are based on the Tables, being corrected and supplemented in the following way: In the first place, as I have so often emphasized, and as is stated in the introduction to the Tables, the amounts quoted for insurance are those which apply to C-licensed vehicles. Hauliers have to pay from 50 to 100 per cent.
more, and I have amended the figures accordingly. I have added estimated, amounts for establishment costs and, in this case, have taken figures which more particularly apply' to long-distance haulage. That means that the establishment costs are high in comparison with what might be expected in other types of business. A correction has been made, in Table II, to provide for the recent increase in drivers' wages, which has come into force since the publication of the 1944 edition of the Tables. The running costs per mile are taken direct from the 1940 and 1944 editions of " The Commercial Motor " Tables of Operating Costs. So far as the fixed charges are concerned, the major increases are in respect of wages and interest on capital outlay.
There have been no fewer than eight additions to the standard wage rates.. for drivers since the inception of the Road Haulage Wages Act in the beginning of 1940. In the case of a driver o?a. 3-tonner, the increase is 26 per cent.; in the case of a 14-tonner it is 24i per cent. A fair average is 25 per cent,, approximately £1 per week, or 5d. per hour on the standard 48-hour week,
There Are No Reliable Figures Available for New-vehicle Cost
The increase in interest charges should, of course, directly reflect the increase in the actual cost of new vehicles. There are no reliable figures for present-day prices, and the increase is shown throughout as being 25 per cent.
Establishment costs, or overheads, have also increased, although, as a matter of fact, there has been a slight decrease during the past six months, due in part to the cessation of fire-watching and to the reduction in the premium for war-damage insurance. The latter, too, should shortly cease to be an item of establishment costs.
Insurance premiums are up in most cases, although I note that, as regards the 3-tonner there has been a slight drop M the average figure. Possibly, the 1940 figure was subse luently discovered to be rather high. The percentage :ncrease in the fixed charges is I7i for the 3-toimer, falling to 13 for the 12-tonner and 14-tonner.
The principal increases in running costs are in respect of
tyres, maintenance and depreciation. Fuel costs have increased only by about 4 per cent., and, lubricating-oil costs to the same extent.
Tyre costs have gone up considerably. Not only are the list prices of corresponding tyre sizes much higher, but the mileage to be expected is much less: The percentage increase approximates to 400, i.e., tyre costs have doubled.
Maintenance costs are up by an annual 17 to 20 per cent. There are three causes for this: (a) The increased cost of materials; (b) the high cost of labour, not only for the reason that wages are up, but because the qualities, on the whole, are down and (c) vehicles are in commission much longer than they used to be and are, therefore, more frequently in need of attention and repair. The standard of driving, too, is, in some case-S, not what it used to be, and that can be an important factor in determining maintenance costs.
. Depreciation is up for the same reason as interest and by the same amount, namely, 25 per cent. It is,sometimes urged that, as in the majority of cases the vehicles are old and were bought at pre-war prices, the depreciatiOn allowance should be unaffected by the rise in the price of new and, in many cases, u.nbought vehicles. I do not agree. " The Commercial Motor figures are, in effect, budgetary, and, in 'assessing depreciation in that sense, the opera tor must bear in mind what he will have to pay for a replacement vehicle rather than what he paid for the old one,'
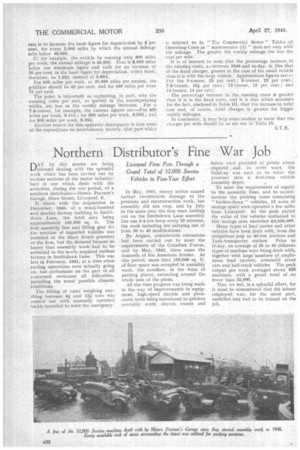
Lower the Mileage the Greater the Depreciation per Unit
There is this further point about depreciation which is often overlooked by those who judge the matter too hastily. The depreciation per unit is greater as the weekly mileage is less. That is because of the effect of obsolescence. It is calculated in this way.
Assume a vehicle to cost £900 when new, complete with tyres. The figure to take as the basis for the assessment of depreciation is the net cost without tyres, say, £800.
Allow 10 per cent, of that as
residual value, i.e., the amount (£80) which the haulier will get for the vehicle when he sells it after it has done, say, 200,000 miles.
Spreading £720 over 200,000 miles gives us 0.86d. per mile as the basic figure for depreciation. That applies only, however, if the vehicle be covering not less than 48,000 miles per annum, and is thus equivalent td an estimated life of rather more than four years. Obsolescence does not, in that period, enter into the calculation.
If the annual mileage does not, however, reach that figure, provision must be made for obsolescence. A good rule is to increase the basic figure for depreciation by 5 per cent. for every 2,900 miles by which the annual mileage falls below 48,000.
exaMple, the vehicle be running only 800 miles per week, the annual mileage is 40,000. That is 8,000 miles below our minimum figure and calls. for an increase of 20 per cent, in the bask figure for depreciation, which must, therefore, be 1.03d.instead of 0.86d.
. For 600 miles per week, or 30,000 miles per annum, the Addition should be 45 per cent, and. for 400 miles per week 75 per cent.
The point is important as explaining, in part, why the running costs per unit, as quoted in the accompanying tables, are less as the weekly mileage increases. For a 7-8-tonner, for example, the current figures are:—For 400 miles per week, 9.4 Id..; for 600 miles per week,. 8.93d.; and for 800 miles per week, 8.55d.
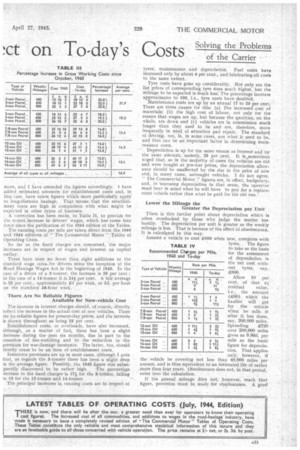
Another reason for this apparent discrepancy is that some of the expenditure on maintenance, namely,•tht part which is referred to in " The Commercial Motor " Tables • of Operating Costs as " maintenance (d) " does mit vary with • the mileage. The greater the weekly mileage the less the cost per mile. : It is of interest to note that the percentage increase_ in the running costs, as-between 1940 and to-day, is; like that of the fixed charges, greater in the case of the small vehicle than it is with the large vehicle. Approximate figures are:— For the 3-tonner, 25 per cent.; 5-tonner, 22 per cent.: 7-8-tonner, 164 per cent.; 12-tonner, 15 per cent.; and 14-tonner, 14 per cent.
The percentage increase -in the running costs is greater than it is in the fixed costs, and it is that which accounts for the fact, disclesed in Table III, that the increase in total cost and, of course, total charges is greater for bigger
weekly mileages.
In conclusion, it may help some readers to know that the charges per mile should be as set out in Table 1V.
S.T.R.