


Ministry Analyses 200,000 Road Accidents
Page 41
If you've noticed an error in this article please click here to report it so we can fix it.
SAFETY-FIRST propagandists and others associated with the efforts to grapple with the road-accident problem will obtain much food for thought from a report recentlycirculated by the Ministry of Transport. It gives a host of valuable statistical data, based on-a meticulous investigation into the eirctimstances of nearly 200,000 road accidents involving personal injury, whether fatal or not, during the year ended March 31, 1937.
After a close perusal of the well-marshalled facts and figures it contains, one is left with the impression that, if our administrators would only give as much practical attention to this vital national problem as has obviously been given to the compilation of the report,many of the present causes for complaint would be removed, although Ministry statisticians might conceivably have less to do !
In several respects, the report takes a somewhat different form from that issued in 1935, largely because the investigation covers non-fatal as well as fatal accidents. The nature of the accidents investigated and their distribution are shown in the following table: It is noteworthy that, whilst pedestrians were held responsible for nearly 40 per cent, of the fatal accidents, they are blamed for only 30 per cent, of the non-fatal cases. On the other hand, the figures for cyclists show 23 per cent. of non-fatal cases, against 17 per cent, of a fatal character. In one-third of the accidents analysed, drivers (not including cyclists) were held to be at fault.
The 10 principal causes of accidents attributed to drivers, accounting for nearly 85 per cent. of the fatal and 78 per cent, of the non-fatal, are shown in the following table, and there are several useful deductions to be made from the percentage figures given.
Whilst in the case of fatal accidents excessive speed, having regard to the conditions, was held to be responsible for nearly a quarter of the total, it fell appreciably as a factor responsible for all classes of accident. The most frequent cause attributed to cyclists, as with motorists, was lack of care when turning from one road into another, most of the accidents arising when a right-hand turn was being made.
The following table shows the sole or main causes of all accidents. The causes ascribed to pedestrians are set out in the following table, and both in fatal and non-fatal cases a lack of heed for traffic when crossing a road was the major cause of accidents.
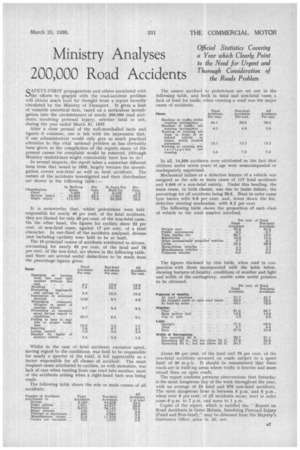
In all, 14,500 accidents were attributed to the fact that children under seven years of age were unaccompanied or inadequately supervised. Mechanical failure or a defective feature of a vehicle was assigned as the sole or main cause of 117 fatal accidents and 4,646 of a non-fatal variety. Under this heading, the main cause, in both classes, was due to brake failure, the percentage for all accidents being 20.6. Next in order came tyre bursts with 9.8 per cent, and, lower down the list, defective steering mechanism, with 8.2 per cent.
The following table shows the proportion of each class of vehicle to the total number involved.
The figures disclosed by this table, when read in conjunction with those incorporated with the table below, showing features of locality, conditions of weather and light and width of the carriageway, enable some useful pointers to be obtained.
About 60 per cent. of the fatal and 76 per cent, of the non-fatal accidents occurred on roads subject to a speed limit of 30 m.p.h. It should be remembered that these roads are in built-up areas where traffic is heavier and more mixed than on open roads.
The report confirms previous observations that Saturday is the most dangerous day of the week throughout the year, with an average of 23 fatal and 676 non-fatal accidents. The most dangerous hour is between 5 p.m. and 6 p.m., when over 9 per cent, of all accidents occur; next in order come 6 p.m. to 7 p.m. and noon to 1 p.m.
Copies of the report, which is entitled the " Report on Road Accidents in Great Britain, Involving Personal Injury (Fatal and Non-fatal)," may be obtained from His Majesty's Stationery Office, price is. 3d. net.