


PREDICTING PERFOR1 NCE
Page 42
Page 43
Page 44
Page 45
If you've noticed an error in this article please click here to report it so we can fix it.
WHILST it, is possible to test a vehicle on a flat road and take comparable tachometer and speedometer readings throughout its speed range, it is hardly a practicable proposition. In the same way, a hill can be climbed many times to ascertain ideal gear ratios and engine-torque values, but it would be a tedious and expensive business. The required figures, however, can be shown in graph form, and can serve to indicate not only what any particular vehicle is capable of. but also whether it will be suitable for the work which the prospective purchaser has in mind.
The requirements of goods and public service vehicle operators differ so greatly. according to the type of country in which the vehicles are used and the load carried. that to buy the wrong vehicle may prove expensive. It is hardly sufficient merely to ask if such-and-such a vehicle will climb this or that hill with a full load. The reply might be in the affirmative, but what proof is there of this if no one has tried to do it? With the aid of the accompanying graphs, 1 can offer a ready guide to the capabilities of any goods or passenger vehicle under varying conditions of operation.
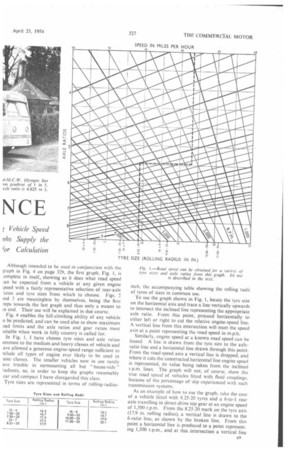
Although intended to be used in conjunction with the graph in Fig. 4 on page 329, the first graph, Fig. 1, is :ornplete in itself,, showing as it does what road speed ;an be expected from a vehicle at any given engine :peed with a fairly representative selection of rear-axle .atios and tyre sizes from which to choose. Figs. 2 ind 3 are meaningless by themselves, being the first teps towards the last graph and thus only a means to in end. Their use will be explained in due course.
Fig. 4 enables the hill-climbing ability of any vehicle o be predicted, and can be used also to show maximum Dad limits and the axle ratios and gear ratios most uitable when work in hilly country is called for.
In Fig. 1, I have chosen tyre sizes and axle ratios ornmon to the medium and heavy classes of vehicle and ave allowed a generous engine-speed range sufficient to tclude all types of engine ever likely to be used in lose classes. The smaller vehicles now in use rarely ave trouble in surmounting all but " house-side " radients, so, in order to keep the graphs reasonably ear and compact I have disregarded this class.
Tyre sizes are represented in terms of rolling-radius inch, the accompanying table showing the rolling radii of tyres of sizes in common use.
To use the graph shown in Fig. 1, locate the tyre size on the horizontal axis and trace a line vertically upwards to intersect the inclined line representing the appropriate axle ratio. From this point, proceed horizontally to either left or right to cut the relative engine-speed line. A vertical line from this intersection will meet the speed axis at a point representing the road speed in m.p.h.
Similarly, engine speed at a known road speed can be found. A line is drawn from the tyre size to the axleratio line and a horizontal line drawn through this point. From the road-speed axis a vertical line is dropped, and where it cuts the constructed horizontal line engine speed is represented, its value being taken from the inclined r.p.m. lines. The graph will not, of course, show the true road speed of vehicles fitted with fluid couplings, because of the percentage of slip experienced with such transmission systems.
As an example of how to use the graph, take the case of a vehicle fitted with 8.25-20 tyres and a 6-to-1 rear axle travelling in direct-drive top gear at an engine speed of 1,500 r.p.m. From the 8.25-20 mark on the tyre axis (17.9 in. rolling radius), a vertical line is drawn to the 6-ratio line, as shown by the broken line. From this point a horizontal line is produced to a point representing 1,500 r.p.m., and at this intersection a vertical line is traced to the speed axis. This gives a road speed of 27 m.p.h.
As a check, the formula can be applied:— Road speedEngine r.p.m. X rolling radius (in.)
168 x overall gear ratio 1,500 x 17.9 168 x 6
=26.7 m.p.h.
As a further example, a coach having 11.00-20 tyres and a rear-axle ratio of 4.4 to 1 has an oil engine governed to 1,800 r.p.m. Allowing for 10 per cent. overrun of the governor, the approximate maximum engine speed is 2,000 r.p.m. The maximum speed of the coach is given on the graph as 54.5, m.p.h.
Compensating for Resistance
Before describing the function of the graphs in Fig. 2 and 3, the resistances to motion that a vehicle has to • overcome should be considered. These consist of chassis friction and rolling, gradient and air resistances.
Chassis friction includes that met with in gears and bearings and oil-churning losses, and, in the case of engine output, there are the drives to the auxiliaries such as the dynamo, water pump and fan, to be considered. In the graphs, only the reduction in torque between the engine and the road wheels is under consideration, as the power losses in the engine have already been allowed for by the manufacturers when stating torque figures, and this reduction varies according to the type of transmission used.
Transmission efficiency can be summarized thus:—
Direct drive with bevel final drive, 93 per cent. Direct drive with worm final drive, 40 per cent.
Indirect drive with bevel final drive, 88 per cent. Indirect drive with worm final drive, 85 per cent.
Rolling resistance is caused by friction between the tyres and the road and is dependent upon the road surface and the gross vehicle weight (g.v.w.), and assuming that correctly inflated tyres in good condition are fitted. For purposes of clarity, the rolling resistances for three typical surfaces have been combined in the torque tables in terms of lb. per ton of torque output. Because in Fig. 4, the gradient climbable is based on g.v.w. and tractive effort, the proportion of resistance remains unaltered.
Gradient resistance is included in Fig. 4 and is directly proportional to the incline and the g.v.w. Air resistance can be neglected because commercial vehicles seldom attain speeds in excess of 60 m.p.h., below which the resistance is not high enough to be appreciable.
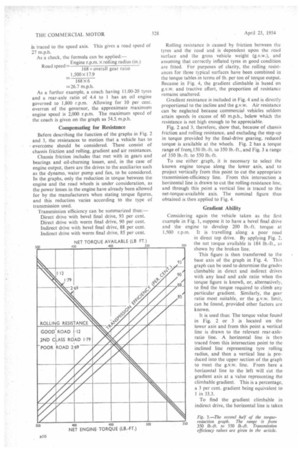
Fig. 2 and 3, therefore, show that, because of chassis friction and rolling resistance, and excluding the step-up in torque provided by the final-drive gearing, reduced torque is ayailable at the wheels. Fig. 2 has a torque range of front 150 lb.-ft. to 350 lb.-ft., and Fig. 3 a range of 350 lb.-ft. to 550 lb.-ft.
To use either graph, it is necessary to select the known engine torque along the lower axis, and to project vertically from this point to cut the appropriate transmission-efficiency line. From this intersection a horizontal line is drawn to cut the rolling-resistance line, and through this point a vertical line is traced to the net-torque-available axis. The nominal figure thus obtained is then applied to Fig. 4.
Gradient Ability
Considering again the vehicle taken as the first example in Fig. 1, suppose it to have a bevel final drive and the engine to develop 200 lb.-ft. torque at 1,500 r.p.m. It is travelling along a poor road in direct top drive. By applying Fig. 2, the net torque available is 184 lb.-ft., as shown by the broken line.
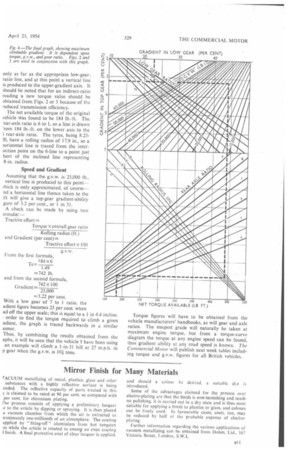
This figure is then transferred to the base axis of the graph in Fig. 4. This graph can be used to determine the grades climbable in direct and indirect drives with any load and axle ratio when the torque figure is knowfi, or, alternatively, to find the torque required to climb any particular gradient. Similarly, the gear ratio most suitable, or the g.v.w. limit, can be found, provided other factors are known.
It is used thus: The torque value found in Fig. 2 or 3 is located on the lower axis and from this point a vertical line is drawn to the relevant rear-axleratio line. A horizontal line is then traced from this intersection point to the inclined line representing tyre rolling radius, and then a vertical line is produced into the upper section of the graph to meet the g.v.w. line. From here a horizontal line to the left will cut the gradient axis at a value representing the climbable gradient. This is a percentage, a 3 per cent, gradient being equivalent to I in 33.3.
To find the gradient climbable in indirect drive, the horizontal line is taken only as far as the appropriate low-gearratio line, and at this point a vertical line is produced to the upper-gradient axis. It should be noted that for an indirect-ratio reading a new torque value should be obtained from Figs. 2 or 3 because of the reduced transmission efficiency.
The net available torque of the original vehicle was found to be 184 lb.-ft. The rear-axle ratio is 6 to 1, so a line is drawn 'rom 184 lb.-ft. on the lower axis to the i rear-axle ratio. The tyres, being 8.2510, have a. rolling radius of 17.9 in., so a Horizontal line is traced from the interection point on the 6-line to a point just hort of the inclined line representing 8-in. radius.
Speed and Gradient
Assuming that the g.v.w. is 23,000 lb., vertical line is produced to this point-vhich is only approximated, of course— rid a horizontal line thence taken to the !ft will give a top-gear gradient-ability gure of 3.2 per cent., or 1 in 31.
A check can be made by using two 3rmulx:— Tractive effort=
With a low gear of 7 to 1 ratio, the adient figure becomes 23 per cent. when ad off the upper scale; this is equal to a I in 4.4 incline. order to find the torque required to climb a given adient, the graph is traced backwards in a similar anner.
Thus, by combining the results obtained from the aphs, it will be seen that the vehicle I have been using an example will climb a 1-in-31 hill at 27 m.p.h. in p gear when the g.v.w. is 101 tons.
Torque figures will have to be obtained from the vehicle manufacturers' handbooks, as will gear and axle ratios. The steepest grade will naturally be taken at maximum engine torque, but from a torque-curve diagram the torque at any engine speed can be found, thus gradient ability at any road speed is known. The Commercial Motor will publish next week tables including torque and g.v.w. figures for all British vehicles.