 1
1 2
2 3
3 4
4 5
5 6
6 7
7 8
8 9
9 10
10 11
11 12
12 13
13 14
14 15
15 16
16 17
17 18
18 19
19 20
20 21
21 22
22 23
23 24
24 25
25 26
26 27
27 28
28 29
29 30
30 31
31 32
32 33
33 34
34 35
35 36
36 37
37 38
38 39
39 40
40 41
41 42
42 43
43 44
44 45
45 46
46 47
47 48
48 49
49 50
50 51
51 52
52 53
53 54
54 55
55 56
56 57
57 58
58 59
59 60
60 61
61 62
62 63
63 64
64 65
65 66
66 67
67 68
68 69
69 70
70 71
71 72
72 73
73 74
74 75
75 76
76 77
77 78
78 79
79 80
80 81
81 82
82 83
83 84
84 85
85 86
86 87
87 88
88 89
89 90
90 91
91 92
92 93
93 94
94 95
95 96
96 97
97 98
98 99
99 100
100 101
101 102
102 103
103 104
104 105
105 106
106 107
107 108
108 109
109 110
110 111
111 112
112 113
113 114
114 115
115 116
116 117
117 118
118 119
119 120
120 121
121 122
122 123
123 124
124 125
125 126
126 127
127 128
128 129
129 130
130 131
131 132
132 133
133 134
134 135
135 136
136 137
137 138
138 139
139 140
140 141
141 142
142 143
143 144
144 145
145 146
146 147
147 148
148 149
149 150
150 151
151 152
152 153
153 154
154 155
155 156
156 157
157 158
158 159
159 160
160 161
161 162
162 163
163 164
164 165
165 166
166 167
167 168
168 169
169 170
170 171
171 172
172 Overloading is it worth it?
Page 93
Page 94
Page 97
Page 98
If you've noticed an error in this article please click here to report it so we can fix it.
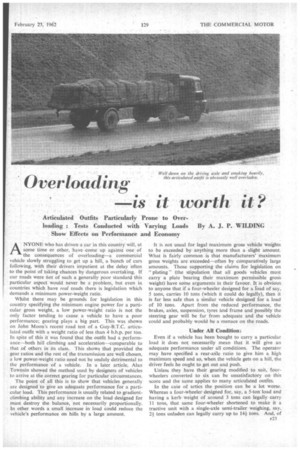
Articulated Outfits Particularly Prone to Over loading : Tests Conducted with Varying Loads By A. J. P. WILDING Show Effects on Performance and Economy
ANYONE who has driven d car in this country will, at some time or other, have come up against one of the consequences of overloading—a commercial vehicle slowly struggling to get up a hill, a bunch of cars following, with their drivers impatient at the delay Often to the point of taking chances by dangerous overtaking. If our roads were not of such a generally poor standard this particular aspect would never be a problem, but even in countries which have real roads there is legislation which demands a minimum power-weight ratio.
Whilst there may be grounds for legislation in this country specifying the minimum engine power for a particular gross weight, a low power-weight ratio is not the only factor tending to cause a vehicle to have a poor performance; gearing plays a big part. This was shown on John Moon's recent road test of a Guy-B.T.C. articulated outfit with a weight ratio of less than 4 b.h.p. per ton. In spite of this it was found that the outfit had a performance—both hill climbing and acceleration—comparable to that of others in its class. This shows that provided the gear ratios and the rest of the transmission are well chosen, a low power-weight ratio need not be unduly detrimental to the performance of a vehicle. In a later article, Alan Townsin showed the method used by designers of vehicles to arrive at the correct gearing for particular circumstances.
The point of all this is to show that vehicles generally arc designed to give an adequate performance for a particular load. This performance is usually related to gradientclimbing ability and any increase on the load designed for Must destroy the balance, not necessarily proportionally. In other words a small increase in load could reduce the vehicle's performance on hills by a large amount.
It is not usual for legal maximum gross vehicle weights to be exceeded by anything more than a slight amount. What is fairly common is that manufacturers' maximum gross weights are exceeded—often by comparatively large amounts. Those supporting the claims for legislation on " plating " (the stipulation that all goods vehicles must carry a plate bearing their maximum permissible gross weight) have some arguments in their favour. It is obvious to anyone that if a four-wheeler designed for a road of say, 5 tons, carries 10 tons (which it could do legally), then it is far less safe than a similar vehicle designed for a load of 10 tons. Apart from the reduced performance, the brakes, axles, suspension, tyres and frame and possibly the steering gear will be far from adequate and the vehicle could and probably would be a menace on the roads.
Under All Condition; Even if a vehicle has been bought to carry a particular load it does not necessarily mean that it will give an adequate performance under all conditions. The operator may have specified a rear-axle ratio to give him a high maximum speed and so. when the vehicle gets on a hill, the driver feels he ought to get out and push.
Unless they have their gearing modified to suit, fourwheelers converted to six can be unsatisfactory on this score and the same applies to many articulated outfits.
In the case of artics the position can be a tot worse. Whereas a four-wheeler designed for, say, a 5-ton load and having a kerb weight of around 3 tons can legally carry 11 tons, that same four-wheeler shortened to make it a tractive unit with a single-axle semi-trailer weighing, say, 2+ tons unladen can legally carry up to 141 tons. And, of
course, the gross weight being moved by the engine is increased from 14 to 20 tons—quite a bit more than the 8 tons for which the basic unit was designed.
There is also the point, of course, that four-wheelers built for a maximum legal gross weight-14 tons—can also be overladen when made into tractive units. Here, though, the position is not so bad, but the engine power intended for 14 tons has to cope with a gross weight of 20 tons—or 24 tons if the tractive unit is used with a twin-oscillating or tandem-axle semi-trailer.
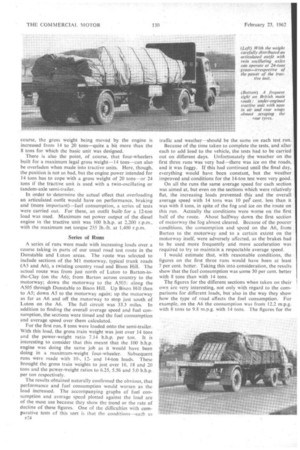
In order to -determine the actual effect that overloading an articulated outfit would have on performance, braking and (more important)—fuel consumption, a series of tests were carried out. For these, an outfit built for a 12-ton load was used. Maximum net power output of the diesel engine in the tractive unit was 100 b.h.p. at 2,200 r.p.m., with the maximum net torque 255 lb.-ft. at 1,400 r.p.m.
Series of Runs A series of runs were made with increasing loads over a course taking in parts of our usual road test route in the Dunstable and Luton areas. The route was selected to include sections of the M1 motorway, typical trunk roads (A5 and A6), a twisting country road and Bison Hill. The actual route was from just north of Luton to Barton-inthe-Clay (on the A6); from Barton across country to the motorway; down the motorway to the A505: along the A505 through Dunstable to Bison Hill. Up Bison Hill then to AS; down AS to the motorway again; up the motorway as far as A6 and off the motorway to stop just south of Luton on the A6. The full circuit was 33.3 miles. In addition to finding the overall average speed and fuel consumption, the sections were timed and the fuel consumption and average speed over them calculated.
For the first run, 8 tons were loaded onto the semi-trailer. With this load, the gross train weight was just over 14 tons and the power-weight ratio 7.14 b.h.p. per ton. It is interesting to consider that this meant that the 100 b.h.p. engine was doing the same job as it would have been doing in a maximum-weight four-wheeler. Subsequent runs were made with 10-, 12and 14-ton loads. These brought the gross train weights to just over 16, 18 and 20 tons and the power-weight ratios to 6.25, 5.56 and 5.0 b.h.p. per ton respectively.
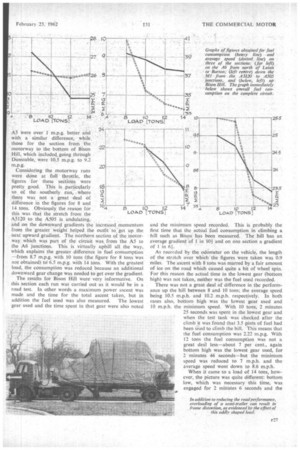
The results obtained naturally confirmed the obvious, that performance and fuel consumption would worsen as the load increased. The accompanying graphs of fuel consumption and average speed plotted against the load are of the most use because they show the trend or the rate of decline of these figures. One of the difficulties with comparative tests of this sort is that the conditions—such as F24 traffic and weather—should be the same on each test run.
Because of the time taken to complete the tests, and after each to add load to the vehicle, the tests had to be carried out on different days. Unfortunately the weather on the first three runs was very bad—there was ice on the roads, and it was foggy. If this had continued until the final day, everything would have been constant, but the weather improved and conditions for the 14-ton test were very good.
On all the runs the same average speed for each section was aimed at, but even on the sections which were relatively fiat, the increasing loads prevented this and the overall average speed with 14 tons was 10 pet' cent. less than it was with 8 tons, in spite of the fog and ice on the route on this run. Actually the conditions were worse on the first half of the route. About halfway down the first section of motorway the fog almost cleared. Because of the poorer conditions, the consumption and speed on the A6, from Barton to the motorway and to a certain extent on the motorway itself, were adversely affected, as the-brakes had to be used more frequently and more acceleration was required to try to maintain a respectable average speed.
I would estimate that, with reasonable conditions, the figures on the first three runs would have been at least 7 per cent. better. Taking this into consideration, the results show that the fuel consumption was some 30 per cent. better with 8 tons than with 14 tons.
The figures for the different sections when taken on their own are very interesting, not only with regard to the comparisons for different loads, but also in the way they show how the type of road affects the fuel consumption. For example, on the A6 the consumption was from 12.2 m.p.g. with 8 tons to 9.8 m.p.g. with 14 tons. The figures for the A5 were over 1 m.p.g. better and with a similar difference, while
those for the section from the motorway to the bottom of Bison Hill, which included going through 13-unstable, were 10.5 m.p.g. to 9.2 m.p.g.
Considering the motorway runs were done at full throttle, the
figures for these sections were pretty good. This is particularly so of the southerly run, where there was not a great deal of difference in the figures for 8 and 14 tons. Obviously, the reason for this was that the stretch from the A5120 to the A505 is undulating, and on the downward gradients the increased momentum from the greater weight helped the outfit to. get up the next upward gradient. The northern section of the Motorway, which was part of the circuit was, from the A5 to the A6 junctions. This is virtually uphill all the way, which explains the greater difference in fuel consumption —from 8.7 m.p.g. with 10 tons (the figure for 8 tons was not obtained) to 6.5 m.p.g. with 14 tons. With the greatest load, the consumption was reduced because an additional downward gear change was needed to get over the gradient.
The results for Bison Hill were very informative. On this section each run was carried out as it would be in a road test. In other words a maximum power ascent was made and the time for the total ascent taken, but in addition the fuel used was also measured. The lowest gear used and the time spent in that gear were also noted
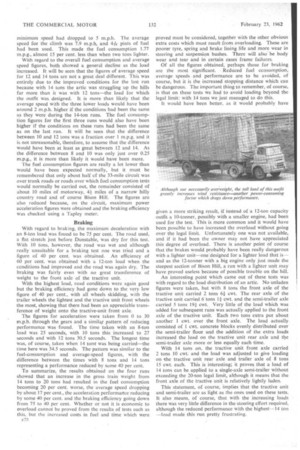
and the minimum speed recorded. This is probably the first time that the actual fuel consumption in climbing a hill such as Bison has been measured. The hill has an average gradient'Of 1 in POI and on one section a gradient of 1 in 6-1.
As recorded by the odometer on the vehicle, the length of the stretch over which the figures were taken was 0.9 miles. The ascent with 8 tons was marred by a fair amount of ice on the road which caused quite a bit of wheel spin. For this reason the actual time in the lowest gear (bottom high) was not taken, neither was the fuel used recorded.
There was not a great deal of difference in the performance up the hill between 8 and 10 tons; the average speed being 10.5 m.p.h. and 10.2 m.p.h. respectively. In both cases also, bottom high was the lowest gear used and 10 m.p.h. the minimum speed. With 10 tons, 2 minutes 25 seconds was spent in the lowest gear and when the test tank was checked after the climb it was found that 3.5 pints of fuel had been used to climb the hill. This means that the fuel consumption was 2.22 mpg. With 12 tons the fuel consumption was not a great deal less—about 7 per cent., again bottom high was the lowest gear used, for 2 minutes 46 seconds—but the minimum speed was reduced to 7 m.p.h. and the average speed went down to 8.6 m.p.h.
When it came to a load of 14 tons, however, the picture was quite different: bottom low, which was necessary this time, was engaged for 2 minutes 6 seconds and the minimum speed had dropped to 5 m.p.h. The average speed for the climb was 7.9 m.p.h. and 4* pints of fuel had been used. This made the fuel consumption 1.77 m.p.g., almost 15 per cent. less than when two tons lighter.
With regard to the overall fuel consumption and average speed figures, both showed a general decline as the load increased. It will be seen that the figures of average speed for 12 and 14 tons are not a great deal different. This was entirely due to the improved conditions for the last run because with 14 tons the artic was struggling up the hills far more than it was with 12 tans—the load for which the outfit was designed. It is more than likely that the average speed with the three lower loads would have been around 2 m.p.h. higher if the conditions had been the same as they were during the 14-ton runs. The fuel consumption figures for the first three runs would also have been higher if the conditions on these runs had been the same as on the last run. It will be seen that the difference between 10 and 12 tons was a fraction over 1 m.p.g. and it is not unreasonable, therefore, to assume that the difference would have been at least as great between 12 and 14. As the difference between 8 and 10 was only just over 0.25 m.p.g., it is more than likely it would have been more.
The fuel consumption figures are really a lot lower than would have been expected normally, but it must be remembered that only about half of the 33-mile circuit was over trunk roads or roads over which fuel consumption tests would normally be carried out, the remainder consisted of about 10 miles of motorway, 4+ miles of a narrow hilly country road and of course Bison Hill. The figures are also reduced because, on the circuit, maximum power acceleration figures were obtained and the braking efficiency was checked using a Tapley meter.
Braking
With regard to braking, the maximum deceleration with an 8-ton load was found to be 75 per cent. The road used, a flat stretch just before Dunstable, was dry for this test, With 10 tons, however, the road was wet and although really unsuitable for a braking test one was tried and a figure of 40 per cent. was obtained. An efficiency of 60 per cent. was obtained with a 12-ton load when the conditions had improved and the road was again dry. The braking was fairly even with no great transference of weight to the front axle of the tractive unit.
With the highest load, road conditions were again good but the braking efficiency had gone down to the very low figure of 40 per cent., with all wheels skidding, with the trailer wheels the lightest and the tractive unit front wheels the most, showing that there had been an appreciable transference of weight onto the tractive-unit front axle.
The figures for acceleration were taken from 0 to 30 mph. through the gears and a similar pattern of reducing performance was found. The time taken with an 8-ton load was 25 seconds, with 10 tons this increased to 27 seconds and with 12 tons 30.5 seconds. The longest time was, of course, taken when 14 tons was being carried—the time here was 34.5 seconds. The pattern was similar to the fuel-consumption and average-speed figures, with the difference between the times with 8 tons and 14 tons representing a performance reduced by some 40 per cent.
To summarize, the results obtained on the four runs showed that an increase in the gross train weight from 14 tons to 20 tons had resulted in the fuel consumption becoming 20 per cent. worse, the average speed dropping by about 17 per cent., the acceleration performance reducing by some 40 per cent, and the braking efficiency going down from 75 to 40 per cent. Whether or not it is economic to overload cannot be proved from the results of tests such as this, but the increased costs in fuel and time which were -22
proved must be considered, together with the other obvious extra costs which must result from 'overloading. These are poorer tyre, spring and brake lining life and more wear in steering and suspension bushes. There will also be body wear and tear and in certain cases frame failures.
Of all the figures obtained, perhaps those for braking are the most significant. Reduced fuel consumption, average speeds and performance are to be avoided, of course, but it is the increased stopping distance which can be dangerous. The important thing to remember, of course, is that on these tests we had to avoid loading beyond the legal limit: with 14 tons we just managed to do this.
It would have been better, as it would probably have given a more striking result, if instead of a 12-ton capacity outfit a 10-tonner, possibly with a smaller engine, had been used for the test. This is more common and it would have been possible to have increased the overload without going over the legal limit. Unfortunately one was not available, and if it had been the owner may not have appreciated this degree of overload. There is another point of course that the brakes would probably have been really dangerous with a lighter unit—one designed for a lighter load that is— and as the 12-tonner with a big engine only just made the steepest section of Bison Hill, a run with a lighter unit may have proved useless because of possible trouble on the hill.
An interesting point which came out of these tests was with regard to the load distribution of an artic. No unladen figures were taken, but with 8 tons the front axle of the tractive unit carried 2 tons 61 cwt. The rear axle of the
tractive unit carried 6.tons cwt. and the semi-trailer axle carried 5 tons 191 cwt. Very little of the load which was added for subsequent runs was actually applied to the front axle of the tractive unit. Each twotons extra put about another I cwt.over the front axle. The load actually consisted of 1 cwt. concrete blocks evenly distributed over the semi-trailer floor and the addition of the extra loads increased the load on the tractive unit rear axle and the semi-trailer axle more or less equally each time.
With 14 tons on, the tractive unit front axle carried 2 tons 10 cwt. and the load was adjusted to give loading on the tractive unit rear axle and trailer axle of 8 tons 15 cwt. each. This is interesting; it proves that a load of 14 tons can be applied to a single-axle semi-trailer without exceeding the 20-ton legal limit, although it means that the front axle of the tractive unit is relatively lightly laden.
This statement, of course, implies that the tractive unit and semi-trailer are as light as the ones used on these tests. It also means, of course, that with the increasing loads there was very little difference in the steering effort required, although the reduced performance with the highest 14 ton —load made this run pretty frustrating.