 1
1 2
2 3
3 4
4 5
5 6
6 7
7 8
8 9
9 10
10 11
11 12
12 13
13 14
14 15
15 16
16 17
17 18
18 19
19 20
20 21
21 22
22 23
23 24
24 25
25 26
26 27
27 28
28 29
29 30
30 31
31 32
32 33
33 34
34 35
35 36
36 37
37 38
38 39
39 40
40 41
41 42
42 43
43 44
44 45
45 46
46 47
47 48
48 49
49 50
50 51
51 52
52 53
53 54
54 55
55 56
56 57
57 58
58 59
59 60
60 61
61 62
62 63
63 64
64 65
65 66
66 67
67 68
68 69
69 70
70 71
71 72
72 73
73 74
74 75
75 76
76 77
77 78
78 79
79 80
80 81
81 82
82 83
83 84
84 85
85 86
86 87
87 88
88 89
89 90
90 91
91 92
92 93
93 94
94 95
95 96
96 97
97 98
98 99
99 100
100 101
101 102
102 103
103 104
104 105
105 106
106 107
107 108
108 109
109 110
110 111
111 112
112 113
113 114
114 115
115 116
116 117
117 118
118 119
119 120
120 121
121 122
122 123
123 124
124 125
125 126
126 127
127 128
128 129
129 130
130 131
131 132
132 133
133 134
134 135
135 136
136 137
137 138
138 139
139 140
140 141
141 142
142 143
143 144
144 145
145 146
146 147
147 148
148 149
149 150
150 151
151 152
152 153
153 154
154 155
155 156
156 157
157 158
158 159
159 160
160 161
161 162
162 163
163 164
164 165
165 166
166 167
167 168
168 169
169 170
170 171
171 172
172 173
173 174
174 175
175 176
176 177
177 178
178 179
179 180
180 181
181 182
182 183
183 184
184 185
185 186
186 The long and short of it
Page 22
If you've noticed an error in this article please click here to report it so we can fix it.
Do European countries running longer, heavier vehicles suffer significantly more accidents than those that aren't? Dylan Gray Jecides whether it's size or what you do with it that counts.
/ARIOUS EU COUNTRIES are currently debating is/nether to follow the example set by Finland and Sweden )y introducing longer, heavier vehicles (LHVs). The \letherlands has already started trials, although other .:ountries, such as Germany, remain sceptical.
The main worry is that road safety could be heavily )ompromised; the most recent accident data in 2004 3eems to indicate otherwise. General road accident ;tatistics released from the Directorate General of Energy 3.nd Transport at the European Commission show Germany as some serious road-safety work to do. With 339,310 Iccidents in one year it topped the league, ahead of Italy 224,553) and Britain (214,194). However, these three ountries have significantly more accidents than any other EU country -the next in line is Spain with 94,009.
And the two countries which have been running LHVs or 36 years enjoy remarkably low accident rates: Sweden ecorded 17,254 and Finland only 6,767. Of course, these ourtries have a much smaller population than those nentioned above, but adjusting the figures to take this nto account has no effect on the rankings Finland, for mample, has an accident rate of 1.29 per thousand people, :ompared with Germany's 4.11.
Vlotorway accidents
-lowever, these figures tell only half the story, because they ire compiled with data from all roads. As LHVs are and will De mainly motorway-bound, comparable data should be aken from that specific source.
Accident figures are significantly lower on these major Gads but the ratios remain very similar. Germany is still top with ?-1 ,458 accidents, followed by Britain's 9,238. Finland's figure is n in imal, showing only 164 accidents on its motorways in 2004.
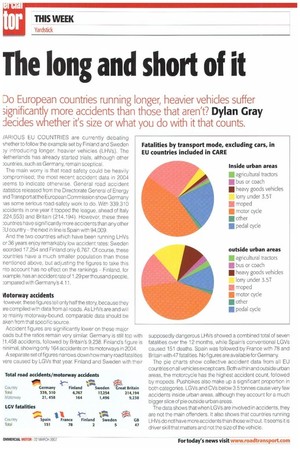
A separate set of figures narrows down how many road fatalities vere caused by LGVs that year. Finland and Sweden with their supposedly dangerous LHVs showed a combined total of seven fatalities over the 12 months, while Spain's conventional LGVs caused 151 deaths. Spain was followed by France with 78 and Britain with 47 fatalities. No figures are available for Germany.
The pie charts show collective accident data from all EU countries on all vehicles except cars. Both within and outside urban areas, the motorcycle has the highest accident count, followed by mopeds. Pushbikes also make up a significant proportion in both categories. LGVs and CVs below 3.5 tonnes cause very few accidents inside urban areas, although they account for a much bigger slice of pie outside urban areas.
The data shows that when LGVs are involved in accidents, they are not the main offenders. It also shows that countries running LHVs do not have more accidents than those without. It seems it is driver skill that matters and not the size of the vehicle.