


mailer Fleets, Fewer Miles, Eigher Costs and Revenue
Page 51
If you've noticed an error in this article please click here to report it so we can fix it.
Passenger Transport Statistics for 1957-8 Show, a Decline in Net Receipts to £12.37m.
ESQUIETING to both operators tnd the travelling public, trends hat have characterized passenger Ft in recent years are confirmed " Statistics of Public Road ;er Transport in Great Britain, (Stationery Office, Is. 6d.). :ture is, broadly, one of reduced reduced mileage, increased costs keep pace with them, increased
annmary of public service vehicles 1 at December 31, 1957, indicates .1-down which continues in the f buses and coaches. There were operating at that date, compared ,771 12 months earlier.
ips more significant of current is a small increase (566) in the of double-deckers (37,044) at the of the single-decker (37,262 in ; against 38,293 the year before). tish Transport Commission follow cral tendency, a small increase in deckers in their fleets being by a similar decrease in single un-down in trolleybuses, totalling as less noticeable: the figure in as 3,506. Tram fleets were from 1,630 to 1.314.
nchment by operators is to be the figures for mileage. In 1956, re was 2,512m. vehicle-miles: in had dropped to 2,406m. In the criod, passenger journeys fell .416m. to 14,760m. The B.T.C. cut back their mileage from 898m. to 849m. and the London Transport Executive alone report a saving of 6m. miles. Trolleybus mileage (127M.) • was not affected to the same extent.
-Increased costs of operation must inevitably be recovered from the public. negatively, by removing unprofitable services, positively by increasing fares. There are, of course, methods of cutting costs internally, but these are not revealed by the present statistics.
On the credit side of the book, 1957 reveals takings of f301.7m. In 1956, they were £289.1m.; the private operators, including the municipal undertakings. earned £167.6m., of which the municipalities were responsible for some £70m. Indeed, local-authority receipts show an increase of about £7m, over the previous year's figure and the other private operators between them, excluding the B.T.C. and L.T.E., some £8.7m. These increased takings came from fewer passengers. In 1956, passenger journeys totalled I5,416m.: in 1957, they had dropped to 14,760m. Of this figure, rather less than a third was won by B.T.C. enterprises, for receipts of £112.8m. Vehicle mileage for all operators was 2,406m. and for the B.T.C. alone, 913m.
In the case of London Transport, the average length of journeys decreased almost infinitesimally from 2.35 miles to 2.32 miles. The takings per passengermile, however, rose from 1.81c1. to 1.98d. B.T.C. provincial and Scottish services report takings increasing from 1.31d. per mile to 1.45d., and from 1.15d. to 1.24d. per mile respectively.
The present statistical survey relates largely to operators owning more than 24 vehicles. They are in the minority, however, for 3.247 operators (including two local authorities) own fleets of no more than five vehicles. Of the 49 large fleets (over 249 vehicles), 12 are worked by municipalities.
Oilers Predominate
So far as fuel is concerned, for every vehicle using petrol, five consume oil fuel. There are today 19,727 vehicles with seating capacities between 49 and 56, 8,035 seating not more than 32, and 9,027 are 56-seaters or larger.
The curves of operation are shown in figures presented for the years 1949 to 1957 inclusive, Still over the 10.000m, mark, passenger journeys have decreased from the peak of 10,807m. in 1955 to 10.287m. (1957). Passenger receipts have crept up from £146m. in 1949 to the 1957 figure of £225.3m. and receipts per vehicle-mile from 19.3d. (1949) to 28.2d. (1957).
So far asthe capital expenditure and revenue accounts are concerned, the statistics relate only to operators of more than 24 vehicles, excluding London Transport. It is shown, however, that in the financial year 1957-58, the assets of the industry, including vehicles, garages, bus stations, machinery and so on, amounted to £234,563,000.
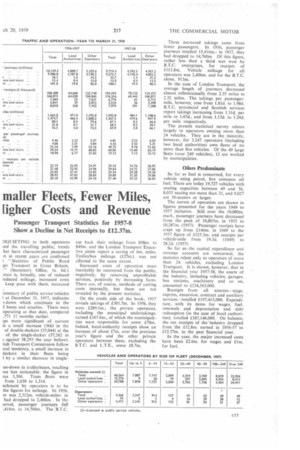
Receipts from all sources-stage. express, excursion, contract and auxiliary services-totalled £197,415,000. Expenditure, with its items for wages, fuel. renewals and depreciation and debt redemption (in the case of local authorities), totalled £185,146,000. On balance. the net receipts of theindustry dropped from the £12.8m. earned in 1956-57 to fl 2.37m, in the past financial year.
In the year, the major increased costs have been £2.6m. for wages and flm. for fuel.