 1
1 2
2 3
3 4
4 5
5 6
6 7
7 8
8 9
9 10
10 11
11 12
12 13
13 14
14 15
15 16
16 17
17 18
18 19
19 20
20 21
21 22
22 23
23 24
24 25
25 26
26 27
27 28
28 29
29 30
30 31
31 32
32 33
33 34
34 35
35 36
36 37
37 38
38 39
39 40
40 41
41 42
42 43
43 44
44 45
45 46
46 47
47 48
48 49
49 50
50 51
51 52
52 53
53 54
54 55
55 56
56 57
57 58
58 59
59 60
60 61
61 62
62 63
63 64
64 65
65 66
66 67
67 68
68 69
69 70
70 71
71 72
72 73
73 74
74 75
75 76
76 77
77 78
78 79
79 80
80 81
81 82
82 83
83 84
84 85
85 86
86 87
87 88
88 89
89 90
90 91
91 92
92 93
93 94
94 95
95 96
96 97
97 98
98 99
99 100
100 101
101 102
102 103
103 104
104 105
105 106
106 107
107 108
108 109
109 110
110 111
111 112
112 113
113 114
114 115
115 116
116 117
117 118
118 119
119 120
120 121
121 122
122 123
123 124
124 125
125 126
126 127
127 128
128 129
129 130
130 131
131 132
132 133
133 134
134 135
135 136
136 137
137 138
138 139
139 140
140 141
141 142
142 143
143 144
144 145
145 146
146 147
147 148
148 149
149 150
150 151
151 152
152 153
153 154
154 155
155 156
156 157
157 158
158 159
159 160
160 161
161 162
162 163
163 164
164 165
165 166
166 167
167 168
168 169
169 170
170 171
171 172
172 173
173 174
174 175
175 176
176 177
177 178
178 179
179 180
180 181
181 182
182 Taking it a into account
Page 22
If you've noticed an error in this article please click here to report it so we can fix it.
:hris Tindall examines DfT figures showing the domestic activities LGVs and the share of the market held by own-account operators.
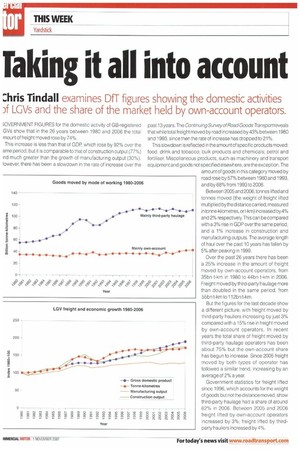
OVERNM ENT FIGURES for the domestic activity of GB-registered GVs show that in the 26 years between 1980 and 2006 the total mount of freight moved rose by 74%.
Ths increase is less than that of GDP which rose by 92% over the ame period, but it is comparable to that of construction output (77%) nd much greater than the growth of manufacturing output (30%). lowever, there has been a slowdown in the rate of increase over the past 13 years. The Continuing Survey of Road Goods Transport reveals that while total freight moved by road increased by 43% between 1980 and 1993, since then the rate of increase has dropped to 21%.
This slowdown is reflected in the amount of specific products moved: food, drink and tobacco; bulk products and chemicals; petrol and fertiliser. Miscellaneous products, such as machinery and transport equipment and goods not specified elsewhere, are the exception. The amount of goods in this category moved by road rose by 57% between 1980 and 1993, and by 68% from 1993 to 2006.
Between 2005 and 2006, tonnes lifted and tonnes moved (the weight of freight lifted multiplied bythe distance carried, measured in tonne-kilometres, or t-km) increased by 4% and 2% respectively. This can be compared with a 3% rise in GDP over the same period, and a 1% increase in construction and manufacturing outputs. The average length of haul over the past 10 years has fallen by 5% after peaking in 1999.
Over the past 26 years there has been a 25% increase in the amount of freight moved by own-account operators, from 35bn t-km in 1980 to 44bn t-km in 2006. Freight moved by third-party haulage more than doubled in the same period, from 55bn t-km to 112bn t-km.
But the figures for the last decade show a different picture, with freight moved by third-party hauliers increasing by just 3% compared with a 15% rise in freight moved by own-account operators. In recent years the total share of freight moved by third-party haulage operators has been about 75% but the own-account share has begun to increase. Since 2005 freight moved by both types of operator has followed a similar trend, increasing by an average of 2% a year.
Government statistics for freight lifted since 1996, which accounts for the weight of goods but not the distance moved, show third-party haulage had a share of around
—r 62% in 2006. Between 2005 and 2006 § freight lifted by own-account operators N N increased by 3%; freight lifted by third
party hauliers increased by 4%.