 1
1 2
2 3
3 4
4 5
5 6
6 7
7 8
8 9
9 10
10 11
11 12
12 13
13 14
14 15
15 16
16 17
17 18
18 19
19 20
20 21
21 22
22 23
23 24
24 25
25 26
26 27
27 28
28 29
29 30
30 31
31 32
32 33
33 34
34 35
35 36
36 37
37 38
38 39
39 40
40 41
41 42
42 43
43 44
44 45
45 46
46 47
47 48
48 49
49 50
50 51
51 52
52 53
53 54
54 55
55 56
56 57
57 58
58 59
59 60
60 61
61 62
62 63
63 64
64 65
65 66
66 67
67 68
68 69
69 70
70 71
71 72
72 73
73 74
74 75
75 76
76 77
77 78
78 79
79 80
80 81
81 82
82 83
83 84
84 85
85 86
86 87
87 88
88 89
89 90
90 91
91 92
92 93
93 94
94 95
95 96
96 97
97 98
98 99
99 100
100 101
101 102
102 103
103 104
104 105
105 106
106 107
107 108
108 109
109 110
110 111
111 112
112 113
113 114
114 115
115 116
116 117
117 118
118 119
119 120
120 121
121 122
122 123
123 124
124 125
125 126
126 127
127 128
128 129
129 130
130 131
131 132
132 133
133 134
134 135
135 136
136 137
137 138
138 139
139 140
140 141
141 142
142 143
143 144
144 145
145 146
146 147
147 148
148 149
149 150
150 151
151 152
152 153
153 154
154 155
155 156
156 The Industry's Progress
Page 85
Page 86
If you've noticed an error in this article please click here to report it so we can fix it.
Outlined in Figures
SOMEHOW or other, for no logical reason in particular, so far as we can discover, everyone feel§ that the beginning of a New Year is the proper time to look appraisingly over the past and hopefully into the future. H we be practical-minded. we will not lodk too far forward into the future or too far backwards into the past. although it be full of victories!
The subject which prompts these observations is our present task of setting down succinctly and statistically the position of the road-transport industry as it now stands. It is all very difficult, for, on the one hand, the greater part of the statistical matter which we should have wished to include in this survey is not at present available; yet, on the other hand, it is virtually impossible to explain the present position, or estimate the future except with reference to the past.
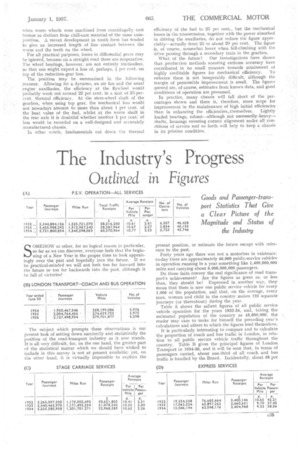
Forty years ago there was not a motorbus in existence; to-day there are approximately 46,090 public-service vehicles in operation running in a year something like 1,400,000,000 miles and carrying about 6,000,000,000 passengers.
Do those facts convey the real significance of road transport's achievement? Are the figures as great as, or less than, they should be? Expressedin another way, they mean that there is now one public service vehicle for every 1,000 of the population, and that, on the average, every man, woman and child in the country makes 125 separate journeys (or thereabout) during the year.
Table A shows the salient figures of all public service vehicle operation for the years 1932-34, and, taking the estimated population of the country as 45,600,000, the reader may care to make for himself the preceding year's calculations and others to which the figures lend themselves.
It is particularly interesting to compare and to calculate the proportion of coach and bus traffic in London, in relation to all public service vehicle traffic throughout the country. Table B gives the principal figures of London Transport in 1934-36, and it will be seen that, in terms of passengers carried, about one-third of all coach and bus traffic is handled by the Board. Incidentally, about 58 per cent, of all passengers originating on the various traffic systems of the Board are coach and bus passengers, and the population of the area served is 9,500,000.
For a full appreciation of the status of the industry it is important to realize the functional divisions of public service vehicle traffic. The comprehensive statistics compiled by the Ministry of Transport enable us to do this, Tables C, D, E and F have, therefore, been prepared to show approximately comparative figures for the various classes. They are not quite comparative, because the figures for 1932 and 1933 exclude particulars in respect of vehicles seating fewer than eight passengers, whereas the figures for 1934 do include them. But the comparison is certainly near enough for our purposes.
Simple calculation shows that stage-carriage services account for rather more than 98 per cent, of all coach and bus traffic.
Some further interesting facts can be stated concerning these figures. It will be noted (see Table A) that there are approximately 5,700 public service vehicle operators, most of whom, as if well known, are small owners. Over 5,300, for instance, own fewer than 10 vehicles each. But starting at the six-vehicle limit, it is a fact that only some 13 per cent, of operators (that is about 750 operators in all) own six or more vehicles, and these, if we leave out London Transport's traffic, deal with about 94 per cent. of all remaining traffic.
A glance at Table C, which gives the pertinent traffic figures of the "six or more vehicle " owners (excluding London Transport), reveals the further interesting fact that local authorities deal with some 42 per cent, of the traffic among this group of operators.
Before we leave the passenger side of the industry a few words must be said about trolleybus services. Thirty-, three systems are now in operation. Those in operation during 1934-33 (excluding London Transport) carried over 309,000,000 passengers on 1,032 vehicle,. running 31,652,000 miles over 349.72 miles of route. In 1926-27 the passengers numbered only 50,382,000. In the year ended June 30, 1936, London Transport figures, which are additional to those given above, were: 69,581,164 passengers; 300 vehicles; 6,884,333 vehicle-miles; and 61 route-miles. In 1934 London Transport operated only 61 trolleybuses over 18 route-miles, and the development thus shown is little more than the beginning of the expansion projected for this, the most important of aIl trolleybus systems. In other parts of the country also considerable extensions are planned or are now taking place.
The industry has not been spectacularly active, but a steady advance has been maintained. The process of consolidation, which has always been one of its most conspicuous features, still continues. Apart from such acquisitions and amalgamations, there have been minor extensions of services, small additions to fleets, and, of course, the usual and now fairly stabilized replacement of vehicles by newer types.
Close restrictions on the operation of road services, imposed by authority with an ever-attentive ear to the complaints of the railway companies, prevent anything but stabilization in competitive spheres of working. Only in the municipal field is any marked development and expan
sion 1-R king p1ae. aud it seems that much may be expected in this branch of passenger transport.
The abandonment of tramways and the substitution of motorbuses or trolleybuses is progressive, and withal an ever-increasing proportion of the population comes to rely upon the coach and bus for its local stage and trunk road express travel facilities.
The publication of statistical information concerning the licensing of goods vehicles at April 30, 1936, enables us to present an up-to-date view of the position in the field of goods transport.
The total number of licence holders under the Road and Rail Traffic Act, 1933, is now over 215,000; less than 121 per cent, of them are holders of A licences, and only 15.29 per cent. have B licences, so that more than 72 per cent, of all goods carriers' licences are represented by Class C operators. There are now 26,522 A-licensees (excluding the railway companies), the number of vehicles involved being 81,431.
Of these operators, 2,876 held B and/or C licences. The remaining 23,646 owners held Only A licences. Of these 54} per cent, owned only one vehicle, 19 per cent, two• vehicles, 9 per cent, three vehicles, and 5 per cent, four vehicles. A-licensees owning more than four vehicles amounted to no more than 121 per cent. of the total number of such operators. The total number of vehicles owned by operators holding A licences was 66,830—an average of less than three vehicles per operator.
• Six railway companies hold A licences in respect of 9,562 vehicles and C licences for a further 78 vehicles.
Altogether 28,393 operators hold only B licences, and of these 78 per cent, owned only one vehicle. More than four vehicles each were possessed by 632 such operators. The average number of vehicles owned by holders only of B licences was 1.4.
With those highly important figures on that side of our industry, which, at the present time in particular, demands everyone's interest and attention, we must bring our survey to a close.