 1
1 2
2 3
3 4
4 5
5 6
6 7
7 8
8 9
9 10
10 11
11 12
12 13
13 14
14 15
15 16
16 17
17 18
18 19
19 20
20 21
21 22
22 23
23 24
24 25
25 26
26 27
27 28
28 29
29 30
30 31
31 32
32 33
33 34
34 35
35 36
36 37
37 38
38 39
39 40
40 41
41 42
42 43
43 44
44 45
45 46
46 47
47 48
48 49
49 50
50 51
51 52
52 53
53 54
54 55
55 56
56 57
57 58
58 59
59 60
60 61
61 62
62 63
63 64
64 65
65 66
66 67
67 68
68 69
69 70
70 71
71 72
72 73
73 74
74 75
75 76
76 77
77 78
78 79
79 80
80 81
81 82
82 83
83 84
84 85
85 86
86 87
87 88
88 89
89 90
90 91
91 92
92 93
93 94
94 95
95 96
96 97
97 98
98 99
99 100
100 101
101 102
102 103
103 104
104 105
105 106
106 107
107 108
108 109
109 110
110 111
111 112
112 113
113 114
114 115
115 116
116 117
117 118
118 119
119 120
120 121
121 122
122 123
123 124
124 125
125 126
126 127
127 128
128 129
129 130
130 131
131 132
132 133
133 134
134 135
135 136
136 137
137 138
138 139
139 140
140 141
141 142
142 143
143 144
144 OUR COST CALCULATIONS are based on the cost table format
Page 40
If you've noticed an error in this article please click here to report it so we can fix it.
used by our sister magazine Motor Transport and comprise two elements, standing costs and running costs.
Standing or fixed costs normally include insurance, vehicle excise duty, depreciation, drivers' wages and establishment (overheads), but we have excluded the latter two as they will be specific to a given operation and do not significantly affect the comparison. Depreciation is taken as a straight line down to zero over a five-year period.
The running costs include current figures for tyres, maintenance and fuel, the latter being based on the latest national average price of diesel at the pump, in this case 81.65p/litre (excluding VAT).
Maintenance is the only running cost variable, the calculation shown in the table being for an annual mileage of 90,000km.
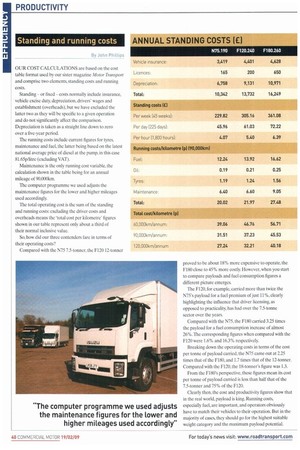
The computer programme we used adjusts the maintenance figures for the lower and higher mileages used accordingly.
The total operating cost is the sum of the standing and running costs: excluding the driver costs and overheads means the 'total cost per kilometre' figures shown in our table represent only about a third of their normal inclusive value.
So,
how did our three contenders fare in terms of their operating costs?
Compared with the N75 7.5-tonner, the F120 12-tonner proved to be about 18% more expensive to operate, the F180 close to 45% more costly. However, when you start to compare payloads and fuel consumption figures a different picture emerges.
The F120, for example, carried more than twice the N75's payload for a fuel premium of just 11%, clearly highlighting the influence that driver licensing, as opposed to practicality, has had over the 7.5-Wane sector over the years.
Compared with the N75, the F180 carried 3.25 times the payload for a fuel consumption increase of almost 26%. The corresponding figures when compared with the F120 were 1.6% and 16.3% respectively.
Breaking down the operating costs in terms of the cost per tonne of payload carried, the N75 came out at 2.25 times that of the F180, and 1.7 times that of the 12-tonner. Compared with the F120, the 18-tonner's figure was 1.3.
From the F180's perspective, these figures mean its cost per tonne of payload carried is less than half that of the 7.5-tonner and 75% of the F120.
Clearly then, the cost and productivity figures show that in the real world, payload is king. Running costs, especially fuel, are important, and operators obviously have to match their vehicles to their operation. But in the majority of cases, they should go for the highest suitable weight category and the maximum payload potential.