


Subsidies: a comparison
Page 13
If you've noticed an error in this article please click here to report it so we can fix it.
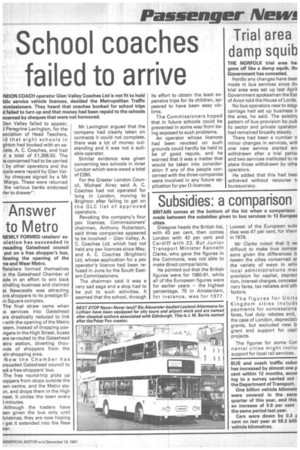
BRITAIN comes at the bottom of the list when a comparison made between the subsidies given to bus services in 13 Europea cities.
Glasgow heads the British list, with 43 per cent, then comes London with 42 per cent and Cardiff with 23. But Junior Transport Minister Kenneth Clarke, who gave the figures in the Commons, was not able to make direct comparisons.
He pointed out that the British figures were for 1980-81, while all of the European figures were for earlier years — the highest percentage, 75 in Amsterdam, for instance, was for 1977. Lowest of the European subE dies was 47 per cent, for Vienr in 1979.
Mr Clarke noted that it wr difficult to make true compel sons given the differences b tween the cities concerned at the variety of ways in whir local administrations mac provision for capital, depreci tion, interest charges, concessi nary fares, tax rebates and oth factors.
The figures for Unite Kingdom cities include payments for concessiona fares, fuel duty rebates and, the case of London, depreciatic grants, but excluded new b grant and support for capii projects.
The figures for some Con nental cities might inclu( support for local rail services.
BUS and coach traffic volun has increased by almost one p cent within 12 months, accor ing to a survey carried out I the Department of Transport.
One billion vehicle kilometr were covered in the seca quarter of this year, and this an increase of 0.8 per cent the same period last year.
Cars were down by 0.3 F cent on last year at 59.3 billi vehicle kilometres.