


THE HAULIER'S INQUIRE WITHIN.
Page 27
Page 28
If you've noticed an error in this article please click here to report it so we can fix it.
A Series of Graphs Prepared from the Tabulated Statistics Published in this Feature in Our Last Issue.
/AM A GREAT believer in graphic representation. After conducting any investigation, however great, or however small it may be, I like, if possible, to set down the results in the form of a graph something like the largest of those which appear on this page and to which I propose to refer in detail shortly. It may be taken for granted that, with few exceptions,
whenever there is a table of figures anything like that which was given in the last article, then a graph can be drawn showing the tabulated results in another form, and such a graph is often very useful, because, by its examination, certain facts, previously unnoticed, are brought to light.
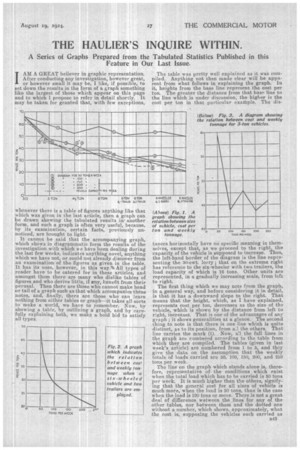
It cannot be said that the accompanying graph, which shows in diagrammatic form the results of the investigation with which we have been dealing during the last few weeks, indicates anything novel, anything which we have not, or could not already discover from an examination of the figures as given in the table. It has its uses, however, in this way.% All types of reader have to be catered for in these articles, and amongst them there are many who dislike tables of figures and who derive little, if any, benefit from their perusal. Then there are those who cannot make head or tail of a graph such as that which accompanies these notes, and, finally, there are those who can learn nothing from either tables or graph—it takes all sorts to make a world, we have to remember. Now, by showing a table, by outlining a graph, and by carefully explaining both, we make a bold bid to satisfy all types. The table was pretty well explained as it was compiled. Anything not then made clear will be apparent from what follows in explaining the graph. In it, heights from the base line represent the cost per ton. The greater the distance from that base line to the Tine which is under discussion, the higher is the cost per ton in that particular example. The dis tances horizontally have no specific meaning in themselves, except that, as we proceed to the right, the capacity of the vehicle is supposed to increase. Thus, the left-hand border of the diagram is the line representing the 30-cwt. lorry ; that on the extreme right has reference to the six-wheeler with two trailers, the load capacity of which is 16 tons. Other units are represented, in a gradually increasing scale, from left to right.
The first thing which we may note from the graph, in a general way, and before considering it in detail, is that it has a downward slope to the right. That means that the height, which, as I have explained, represents cost per ton, decreases as the size of the vehicle, which is shown by the distance from left to right, increases. That is one of the advantages of any graph ; it shows generalities at a glance. The second thing to note is that there is one line which is quite distinct, as to its position, from all the others. That line carries the mark (1). Now, all the full lines in the graph are numbered according to the table from which they are compiled. The tables (given in last week's article) are numbered from I to 5, and they give the data on the assumption that the weekly totals Of loads carried are 50, 100, 150, 200, and 250 tons per week.
The line on the graph which stands alone is, therefore, repreeentative of the conditions which exist when the total Toad which has to be carried is 50 tons per week. It is much higher than the others, signifying that the general cost for all sizes of vehicle is much more, when the load is 50 tons, than is the case when the load is 100 tons or more. There is not a great deal of difference wetween the lines for any of the other tables, nor between them and the dotted one without a number, which shows, approximately, what the cost is, supposing the vehicles each carried as much as they conveniently could during the week.
The graph shows, therefore, that when the load :s much less than 100 tons per week, some other means of conveyance than those discussed should be considered, to ascertain if a cheaper method could be found. So far as we are at present concerned, we need obviously .only concern ourselves with the diagrams which show the cost per ton with various vehicles for weekly tonnages of 100 and upwards. Tfre diagram, as regards that part, indicates that the drop in cost is gradual after the 4i-ton size has been reached, and that we should only, therefore, consider the larger machines for the class of work we have in mind.
The other figures have been included to draw attention to another aspect of this problem. The largest machines—the six-wheelers—increase in economy steadily all the time as the load is increased. That condition does not obtain with the smaller vehicles, of which I have taken the three-tonner as an example. This, as is apparent on examination of the tables but is more clearly shown on the diagram, is very dear at 50 tons per week, cheap at 100 tons, but becomes dearer again at 150 tons. An important condition in relation to economy is illustrated in this diagram. When the three-tonner employed delivering 100 tons a week, it is fully loaded all the time (in one direction, of course). That is the condition which makes for economy in running commercial vehicles. When, in this example, the tonnage exceeds 100 per week, one three-tonner is not enough, and, unfortunately, two, which are required if. tha 150 tons is to be delivered without excessive overtime, are too much for that load, which is, therefore, carried less economically than the 100 tons is by one vehicle; or, again, the 200 tons by two vehicles, which points to the need for a second vehicle of smaller capacity. The same lack of economy would be observable in all cases, if the fully loaded condition be not achieved. If, for example, with any size of vehicle, and at any weekly load, it was not possible to deliver in full loads, as, for instance, would be the case if fairly rapid deliveries had to be made to a variety of customers, then a considerable increase in the price per ton delivered would occur, even if the average distance which the load had to be carried remained, as has been the case throughout-this problem, seven miles.
THE SKOTCH,