 1
1 2
2 3
3 4
4 5
5 6
6 7
7 8
8 9
9 10
10 11
11 12
12 13
13 14
14 15
15 16
16 17
17 18
18 19
19 20
20 21
21 22
22 23
23 24
24 25
25 26
26 27
27 28
28 29
29 30
30 31
31 32
32 33
33 34
34 35
35 36
36 37
37 38
38 39
39 40
40 41
41 42
42 43
43 44
44 45
45 46
46 47
47 48
48 49
49 50
50 51
51 52
52 53
53 54
54 55
55 56
56 57
57 58
58 59
59 60
60 61
61 62
62 63
63 64
64 65
65 66
66 67
67 68
68 69
69 70
70 71
71 72
72 73
73 74
74 75
75 76
76 77
77 78
78 79
79 80
80 81
81 82
82 83
83 84
84 85
85 86
86 87
87 88
88 89
89 90
90 91
91 92
92 93
93 94
94 95
95 96
96 97
97 98
98 99
99 100
100 101
101 102
102 103
103 104
104 105
105 106
106 107
107 108
108 109
109 110
110 111
111 112
112 113
113 114
114 115
115 116
116 117
117 118
118 119
119 120
120 121
121 122
122 123
123 124
124 125
125 126
126 127
127 128
128 129
129 130
130 131
131 132
132 133
133 134
134 135
135 136
136 137
137 138
138 139
139 140
140 141
141 142
142 143
143 144
144 145
145 146
146 147
147 148
148 149
149 150
150 151
151 152
152 153
153 154
154 155
155 156
156 157
157 158
158 159
159 160
160 161
161 162
162 163
163 164
164 165
165 166
166 167
167 168
168 169
169 170
170 171
171 172
172 173
173 174
174 175
175 176
176 177
177 178
178 179
179 180
180 181
181 182
182 183
183 184
184 185
185 186
186 187
187 188
188 189
189 190
190 191
191 192
192 193
193 194
194 195
195 196
196 197
197 198
198 199
199 200
200 201
201 202
202 203
203 204
204 205
205 206
206 207
207 208
208 I t's not often that Commercial Motor feels like thanking the
Page 53
Page 54
Page 55
If you've noticed an error in this article please click here to report it so we can fix it.
government for the way its helping the haulage industry. But even we have to concede that free software designed to help small fleet operators analyse and improve their efficiency can't be a bad thing. And that's exactly what's on offer from the government-funded Energy Saving Trust (EST) in the form of theTransportEnergy BestPractice Small Fleet Performance Management Tool (SFPMT).
Endorsed by both the Freight Transport Association which helped develop it and the Road Haulage Association. SFPMT isn't really a piece of software at all, but a preformatted Microsoft Excel spreadsheet with a manual that tells you how to use it.
The spreadsheet works like any other Excel file and consists of 18 worksheets that are used to input data and generate the all-important reports.The SFPMT is designed to give operators a consistent basis from which to measure their vehicles performance in areas including costs, vehicle utilisation,customer service and legal compliance.
The software produces 22 key performance indicators (KPIs) covering five core areas: • Fleet costs • Operational efficiency • Standards of customer service • Compliance • Maintenance Individual KPIs. in turn, include average cost per unit delivered, average running cost in pence per mile, average standing costs, average driver cost, total mileages (laden and empty) per vehicle, average vehicle fill, percentage of late deliveries, volume of damages and complaints, overloads, vehicle traffic infringements,drivers' hours infringements, traffic accidents, percentage of MoT failures and percentage of reported vehicle defects rectified within 24 hours.
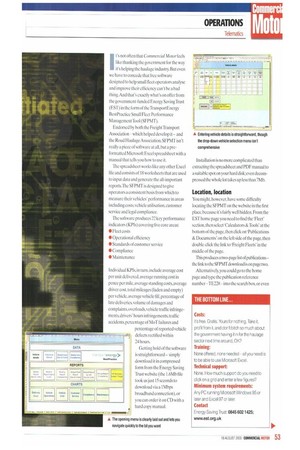
Getting hold of the software is straightforward simply download it in compressed lOrm from the Energy Saving Trust website (the 1.6Mb file took us just 15 seconds to download via a 1Mbps broadband connection), or you can order it on CD with a hard copy manual. Installation is no more complicated than extracting the spreadsheet and PDF manual to a suitable spot on your hard disk; even decompressed the whole lot takes up less than 7Mb.
Location, location
You might, however, have some difficulty locating the SFPMT on the website in the first place. because it's fairly well hidden. From the EST home page you need to find the 'Fleet' section, then select 'Calculators &Tools' at the bottom of the page, then click on Publications & Documents' on the left side of the page, then double-click the link to 'Freight Fleets' in the middle of the page.
This produces a two-page list of publicationsthe link to the SFPMT download is on page two.
Alternatively, you could go to the home page and type the publication reference number -TE228 into the search box, or even go straight to www.est.org.ukilleeti publicationstindex.cfm?mode=listing&pub_ id=166#publo6, if you can be bothered to type that lot in.
Once you've got past all this and opened the file, things are, thankfully, rather simpler.The opening menu screen is clearly divided into three key areas: data entry; numeric reports; and a charts section to illustrate graphically how your business and fleet are performing.
As with most other fleet management software, you need to spend a bit of time entering your core data before the system can get to work.This starts with details of your individual vehicles, including the type of vehicle, load capacity, units carried, original cost and depreciation period, annual insurance cost and odo meter reading.
Once you've entered the vehicles this way, you set up the accounting year over which to monitor things and the number of periods to subdivide this into — either 12 individual calendar months or 13 periods of four weeks apiece.When you've confirmed which vehicles are in service during the various periods, you're ready to start entering 'live' data.
Weekly input The spreadsheet has been structured for this information to be entered on a weekly basis. This is handy because it cuts up the monthly input workload into smaller chunks and lets you see how performance varies from week to week, rather than just from month to month.
The information you'll be entering for each vehicle includes updated odometer reading, miles run empty, vehicle hours worked.driver hours, driver costs, litres of fuel purchased and cost, maintenance costs, number of trips carried out, number of units delivered. number of late delivcries, number of incidents of damaged goods and number of customer complaints received.
A similar process updates the spreadsheet on your compliance perform ance.You can enter the number of inspections each vehicle has received during the week (splitting these up into due and overdue). the number of driver-reported defects (and how quickly they have been rectified),MoT failures or prohibitions, overloads, traffic infringe ments, drivers' hours or records infringements and traffic accidents.
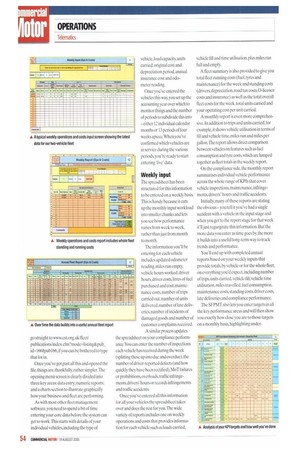
Once you've entered all this information for all your vehicles the spreadsheet takes over and does the rest for you.The wide variety of reports includes one on weekly operations and costs that provides information for each vehicle such as loads carried, vehicle fill and time utilisation, plus miles run full and empty.
A fleet summary is also provided to give you total fleet running costs (fuel, tyres and maintenance) for the week and standing costs (drivers, depreciation, road tax costs, 0-licence costs and insurance) as well as the total overall fleet costs for the week, total units carried and your operating cost per unit carried.
A monthly report is even more comprehensive. In addition to trips and units carried, for example, it shows vehicle utilisation in terms of fill and vehicle time, miles run and miles per gallon.The report allows direct comparison between vehicles on features such as fuel consumption and tyre costs, which are lumped together as fleet totals in the weekly report.
On the compliance side, the monthly report summarises individual vehicle performance across the whole range of KPIs that cover vehicle inspections, maintenance, infringements, drivers' hours and traffic accidents.
Initially, many of these reports are stating the obvious — you tell it you've had a single accident with a vehicle in the input stage and when you get to the report stage for that week it'll just regurgitate this information. But the more data you enter as time goes by, the more it builds into a useful long-term way to track trends and performance.
You'll end up with completed annual reports based on your weekly inputs that provide totals, by vehicle or for the whole fleet, on everything you'd expect, including number of trips, units carried, vehicle fill, vehicle time utilisation, miles travelled, fuel consumption, maintenance costs, standing costs, driver costs, late deliveries and compliance performance.
The SFPMT also lets you enter targets in all the key performance areas and will then show you exactly how close you are to those targets on a monthly basis, highlighting under achievements in red. So whether you want to aim for fewer late deliveries, better vehicle fill or simply fewer missed vehicle inspections, you can clearly see what progress you're making as time goes by.
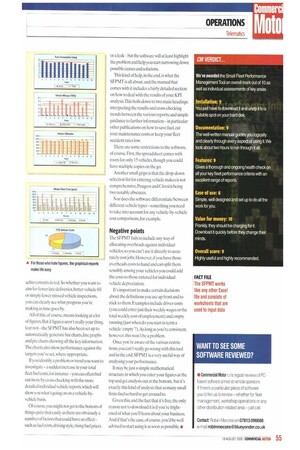
All of this, of course, means looking at a lot of figures. But if figures aren't really your thing, fear not — the SFPMT has also been set up to automatically generate bar charts, line graphs and pie charts showing all the key information. The charts also show performance against the targets you've set, where appropriate.
If you identify a problem or trend you want to investigate —a sudden increase in your total fleet fuel costs, for instance —you can often find out more by cross-checking with the more detailed individual vehicle reports, which will show you what's going on on a vehicle-byvehicle basis.
Of course, you might not get to the bottom of things quite that easily as there are obviously a number of factors that could have an effect — such as fuel costs, driving style, rising fuel prices or a leak — hut the software will at least highlight the problem and help you start narrowing down possible causes and solutions.
This kind of help, in the end, is what the SFPMT is all about, and the manual that comes with it includes a fairly detailed section on how to deal with the results of your KPI analysis.This boils down to two main headings: interpreting the results and cross-checking trends between the various reports; and simple guidance to further information —in particular other publications on how to save fuel, cut your maintenance costs or keep your fleet accident rates low.
There are some restrictions to the software, of course. First, the spreadsheet comes with room for only 15 vehicles, though you could have multiple copies on the go.
Another small gripe is that the drop-down selection list for entering vehicle makes is not comprehensive, Peugeot and Citroi1n being two notable absences.
Nor does the software differentiate between different vehicle types —something you need to take into account for any vehicle-by-vehicle cost comparisons, for example.
Negative points the SFPNIT fails to include any way of allocating overheads against individual vehicles, so you can't use it directly to accurately cost jobs. However, if you have those overheads costs to hand and can split them sensibly among your vehicles you could add the costs to those entered for individual vehicle depreciation.
It's important to make certain decisions about the definitions you use up front and to stick to them. Examples include driver costs (you could enter just their weekly wages or the total weekly cost of employment) and empty running (just when do you start to term a vehicle 'empty'?).As long as you're consistent. however, this won't be a problem.
Once you're aware of the various restrictions, you can't really go wrong with this tool and in the end, SFPMT is a very useful way of analysing your performance.
It may be just a simple mathematical structure in which you enter your figures at the top and get analysis out at the bottom, but it's exactly this kind of analysis that so many small firms find so hard to get around to.
Given this, and the fact that it's free, the only reason not to download it is if you're frightened of what you'll learn about your business. And if that's the case, of course, you'd be well advised to start using it as soon as possible. •