 1
1 2
2 3
3 4
4 5
5 6
6 7
7 8
8 9
9 10
10 11
11 12
12 13
13 14
14 15
15 16
16 17
17 18
18 19
19 20
20 21
21 22
22 23
23 24
24 25
25 26
26 27
27 28
28 29
29 30
30 31
31 32
32 33
33 34
34 35
35 36
36 37
37 38
38 39
39 40
40 41
41 42
42 43
43 44
44 45
45 46
46 47
47 48
48 49
49 50
50 51
51 52
52 53
53 54
54 55
55 56
56 57
57 58
58 59
59 60
60 61
61 62
62 63
63 64
64 65
65 66
66 67
67 68
68 69
69 70
70 71
71 72
72 73
73 74
74 75
75 76
76 77
77 78
78 79
79 80
80 81
81 82
82 83
83 84
84 85
85 86
86 87
87 88
88 89
89 90
90 91
91 92
92 93
93 94
94 95
95 96
96 97
97 98
98 99
99 100
100 101
101 102
102 103
103 104
104 105
105 106
106 107
107 108
108 109
109 110
110 111
111 112
112 113
113 114
114 115
115 116
116 117
117 118
118 119
119 120
120 121
121 122
122 123
123 124
124 125
125 126
126 127
127 128
128 129
129 130
130 131
131 132
132 133
133 134
134 135
135 136
136 137
137 138
138 139
139 140
140 141
141 142
142 143
143 144
144 145
145 146
146 147
147 148
148 149
149 150
150 151
151 152
152 153
153 154
154 155
155 156
156 157
157 158
158 159
159 160
160 161
161 162
162 163
163 164
164 165
165 166
166 167
167 168
168 169
169 170
170 171
171 172
172 173
173 174
174 175
175 176
176 177
177 178
178 179
179 180
180 181
181 182
182 183
183 184
184 185
185 186
186 187
187 188
188 189
189 190
190 Meals on wheels
Page 26
If you've noticed an error in this article please click here to report it so we can fix it.
With the government determined to make us feel guilty about our carbon footprint, this week's Yardstick looks at the changing face of food transport and the emissions it produces.
THIS WEEK'S Yardstick examines the environmental and social impact of delivering food to UK consumers.
Commissioned by the Department for Environment, Food and Rural Affairs (Defra), the latest report relies on figures from 2004 — the last year for which estimates are published.
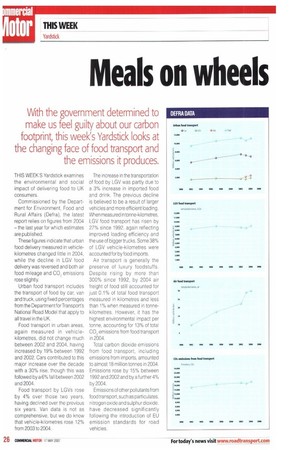
These figures indicate that urban food delivery measured in vehiclekilometres changed little in 2004, while the decline in LGV food delivery was reversed and both air food mileage and CO2 emissions rose slightly.
Urban food transport includes the transport of food by car, van and truck, using fixed percentages from the Department for Transport's National Road Model that apply to all travel in the UK.
Food transport in urban areas, again measured in vehiclekilometres, did not change much between 2002 and 2004, having increased by 19% between 1992 and 2002. Cars contributed to this major increase over the decade with a 30% rise, though this was followed by a 6% fall between 2002 and 2004.
Food transport by LGVs rose by 4% over those two years, having declined over the previous six years. Van data is not as comprehensive, but we do know that vehicle-kilometres rose 12% from 2003 to 2004. The increase in the transportation of food by LGV was partly due to a 3% increase in imported food and drink. The previous decline is believed to be a result of larger vehicles and more efficient loading. When measured in tonne-kilometres, LGV food transport has risen by 27% since 1992, again reflecting improved loading efficiency and the use of bigger trucks. Some 38% of LGV vehicle-kilometres were accounted for by food imports.
Air transport is generally the preserve of luxury foodstuffs. Despite rising by more than 300% since 1992, by 2004 air freight of food still accounted for just 0.1% of total food transport measured in kilometres and less than 1% when measured in tonnekilometres. However, it has the highest environmental impact per tonne, accounting for 13% of total CO2 emissions from food transport in 2004.
Total carbon dioxide emissions from food transport, including emissions from imports, amounted to almost 18 million tonnes in 2004. Emissions rose by 15% between 1992 and 2002 and by a further 4°/c. by 2004.
Emissions of other pollutants from food transport, such as particulates, nitrogen oxide and sulphur dioxide, have decreased significantly following the Introduction of EU emission standards for road vehicles.