


Ringing the cost changes can contain rates
Page 43
Page 44
If you've noticed an error in this article please click here to report it so we can fix it.
by Johnny Johnson
then customer resistance to continual rates increases grows then varying )st factors can help to maintain profit, give a margin for negotiation id bring forward the break-even point.
3 operating costs rise and the resulting reases in rates must be negotiated more frequently with customers, it comes increasingly difficult to rsuade those customers that higher :es are necessary. In these days, of urse, the sensible operator will .eady have spoken to his customers d arranged meetings about rates at t longer than quarterly. intervals.
As resistance becomes apparent to m the most obvious rates adjustans, perhaps involving eventually a t refusal to pay more, the haulier will thrown back on his own resources d compelled to look for economies tong which will undoubtedly be cost iings brought about by the adjustTit of costing factors.
En considering what adjustments can made, it must be realized t it there factors which are outside the control the operator these are termed fixed as.
7.ixed costs are those costs which inot be varied by any action which operator can take. For instance, the partment of Inland Revenue sets the ount of road tax payable on a licular vehicle and apart from selling one he has and buying another with ower unladen weight, the operator inot influence the annual amount of Umost all standing costs are fixed ts. Almost all because insurance miums, for instance, can be varied by Tying around, but this is the subject mother article and will be dealt with I. Therefore, for the purposes of this cle it has been assumed that all -Kling costs are fixed costs and that economies to be made will emanate m the running (or variable) cost :ors which are largely under the trol of the operator.
he largest of these variable costs is I. Any economy made in the sumption of fuel diesel or petrol will be well worthwhile and quately reward the effort made. If 32-ton artic diesel unit included in ' as representing the average vehicle, then the extent of possible savings can be demonstrated.
Even an extra 1/2mpg will result in a saving of £3.52 a week at a weekly mileage of £800 or £4.40 a week at 1,000 miles a week. Not a lot, you might think, but in a fleet of 10 vehicles it becomes £35.20 and £44 a week and £1,462.50 and £1,980 a year respectively. There are a number of ways in which fuel economy can be achieved, ranging from a direct appeal to drivers to use the accelerator gently to using wind shields to reduce drag (see CM February 7). The last method showed improvement of up to 10 per cent more than is needed to show a 1/2 mpg improvement on which I have based my figures.
Tyre life
Worthwhile economies are possible as the result of extending tyre life. An additional 10,000 miles of running on a set of tyres can result in savings of £2.24 a week if 800 miles in the weekly average and £2.80 at 1,000 miles weekly. It needs little ingenuity to convert this to £990 and £1,260 a year respectively for the I 0vehicle fleet.
A few minutes making sure that tyres are properly inflated and removing stones and so on from the tread will help' to prolong tyre life.
Because the lubrication factor, which involves sump oil only, is minimal no attempt has been made to vary this factor. Although a large saving can be shown by extending the life of the vehicle and thus reducing the depreciation cost per mile, this is likely to be reduced somewhat by a corresponding increase in maintenance costs.
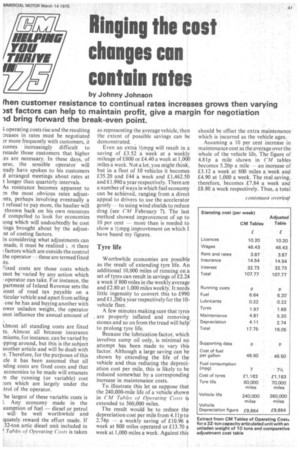
To illustrate this let us suppose that the 240,000-mile life of a vehicle shown in ('Al Tables of Operating Costs is extended to 360,000 miles.
The result would be to reduce the depreciation cost per mile from 4.11p to a weekly saving of £10.96 a week at 800 miles operated or £13.70 a week at 1,000 miles a week. Against this should be offset the extra maintenance which is incurred as the vehicle ages.
Assuming a 10 per cent increase in maintenance cost as the average over the whole of the vehicle life. The figure of 4.8 I p a mile shown in ('Al tables becomes 5.20p a mile an increase of £3.12 a week at 800 miles a week and £4.90 at 1,000 a week. The real saving, therefore, becomes £7.84 a week and £8.80 a week respectively. Thus, a total weekly saving can be achieved as follows. On fuel £3.52 or £4.40; on tyres £2.24 or £2.80; on depreciation £7.84 or £8.80 depending on the weekly mileage.
This results in a total possible saving of £ 13.60 or £16 per vehicle per week. Of course, to obtain the maximum possible benefit from these savings, rates should continue to be based on the former costings. The difference between the two, however, gives a margin for rates negotiation.
The adjustment of cost factors will make a difference to the break-even point of the business, however.
From the break-even charts shown, if the vehicle is operated an average of 1,000 miles a week — 50,000 miles a year — then the break-even point is reached at £9,000 revenue or 22,000 miles in contrast to that achieved under the original costings of nearly £10,000 or £25,000 miles.
The break-even point is, of course, that point in the business year when the operator has done sufficient business to ensure that he cannot make a loss.