


Lion's share of increased tonnage won by public hauliers
Page 20
Page 21
If you've noticed an error in this article please click here to report it so we can fix it.
• The latest "Survey of the Transport of Goods by Road", published by the DoE this week, is, writes John Darker, a vast compendium of information about the industry. It shows a substantial increase in the carriage of goods by road — an increase in the period from 1962 to 1968 from 33.6 thousand million ton-miles to 47.0 thousand million ton-miles. While road hauls increased by 33 per cent in the 1958-1962 period there was a 40 per cent growth rate in the years 1962-1968.
The annual tonnage of goods carried by road increased. from 1,248 m.tons in 1962 to 1,658 m.tons in 1967/8 or by 33 per cent, as compared with a IT+ per cent increase between 1958 and 1962. The share of road haulage in the total tonnage of goods in domestic transport increased from 81 to 85 per cent between 1962 and 1967/8.
The 1967/8 survey was the fourth in a series of inquiries. Previous surveys were in 1952, 1958 and 1962. It is regrettable that the details take so long to publish.
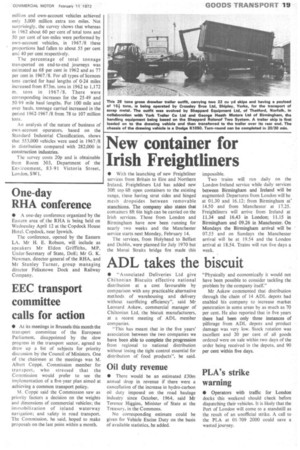
The percentage of heavy vehicles in the 5-8 ton category almost doubled in the period covered Since the 1962 survey and vehicles over 8 tons unladen weight more than doubled. In contrast, the numbers of vehicles in the 2-3 ton unladen weight range fell by over a quarter.
Changes in the weight composition of vehicles in the survey period had relatively little effect on C licence fleets but at the heavier end of the scale public haulage vehicles (A and B licences) over 5 tons unladen increased by 50,000 to 76,000, whereas the numbers of own-account vehicles in this category increased by only 19,000 to 60,000. In the 1967/68 survey vehicles over 5 tons unladen weight constituted 36 per cent of all public haulage
vehicles and 9 per cent of all goods vehicles as compared with 14 per cent and 5 per cent respectively in 1962. The proportion of public haulage -vefiieles over 8 tons unladen weight rose from 3 per cent in 1962 to 10 per cent in 1967 /8, but, as stated above, this shift to heavier vehicles was much more marked in the public haulage field.
Another striking change over the survey period was the increase in the number of articulated vehicles from about 55,000 in 1962 to about 83,000 in 1967 /8. In both years public haulage vehicles contained a larger proportion of artics than in the own account fleets.
The survey highlights that the increased tonnage carried by road between 1962 and 1967/8 was undertaken in large part by public haulage vehicles. In this period the total tonnage carried by road increased by 410 m. tons of which 163m. tons went by own account vehicles and 246m. tons by public haulage vehicles. The ton-miles performed by public hauIageincreased by 11,000 million and own-account vehicles achieved only 3,000 million extra ton miles. Not surprisingly, the survey shows that whereas in 1962 about 60 per cent of total tons and 50 per cent of ton-miles were performed by own-account vehicles, in 1967/8 these proportions had fallen to about .55 per cent and 40 per cent respectively.
The percentage of total tonnage transported on end-to-end journeys was estimated as 68 per cent in 1962 and as 77 per cent in 1967/8. For all types of licences tons carried for haul lengths of 0-24 miles increased from 873m. tons in 1962 to 1,172 m. tons in 1967 /8. There were corresponding increases for the 25-49 and 50 99 mile haul lengths. For 100 mile and over hauls, tonnage carried increased in the period 1962-1967 /8 from 78 to 107 million tons.
An analysis of the nature of business of own-account operators, based on the Standard Industrial Classification, shows that 553,000 vehicles were used in 1967/8 in distribution compared with 282,000 in construction industries.
The survey costs 20p and is obtainable from Room 303, Department of the Environment, 83-91 Victoria Street, London. SW1.