


Users' Figures Reveal Possibilities of Economy Latent in New Types.
Page 48
Page 49
If you've noticed an error in this article please click here to report it so we can fix it.
The Results of Operators Compared with Those Embodied in "The Commercial Motor Tables and Those Claimed by a Manufacturer
STEAM-WAGON OPERATING COSTS INVESTIGATED
By S.T.R.
IT is not necessary to be an enthusiast about steam wagons in order to obtain good results from them, but there is no doubt that an enthusiast can achieve remarkably economical running. One of the several users of steam wagons whom I interviewed to obtain information for this article was undoubtedly an enthusiast.
He had a dozen steam wagons— six of them on solid tyres and six on pneumatics. He has always used steam wagons ; the family have been steam-wagon and traction-engine specialists for generations, going right back, in their ancestral experience, to the earliest steam tractionengine days. The results that they obtain as the outcome of this specialization are exemplified by the following extracts from my notes of the interview:— One pneumatic-ty red steam wagon makes a round journey of 150 miles, using less than 6 cwt. of coal. Another, not in itself of recent date, although it has been modified and imprOved, is stated regularly to cover 20 miles to the cwt. when engaged on local haulage.
Even Distribution of Work.
The fleet as a whole is fairly evenly divided, 40 per cent. of the work done being main-road haulage over a 70-mile or 80-mile route, and 60 per cent. local work in connection with the transport of sand and ballast. The four-wheeled steam wagons operated by this concern run 50 miles per tank a water, and the six-wheelers 40 miles.
The figures for tyre wear are extraordinarily good, 30,000 miles per set of pneumatics being the usual experience. There are, however, some curious and contradictory figures for oil consumption; generally, that of cylinder oil is at the rate of 400 miles to the gallon. One wagon will .require about 11-2 gal 1330 Ions per 600 miles of running—a week's work. Experiments on another vehicle to test the oil consumption disclosed that, in certain circumstances, the capacity of the wagon concerned was a gallon. per 6,000 miles!
I am told that the vehicles are repaired and maintained by four mechanics and that the average cost per week per vehicle is from £2 to £2 2s. The figures are, however, not complete, in that I was unable to ascertain whether they merely relate to wages and materials, or whether they cover .a proper allowance for overheads and rent of premises. Nor could I allocate the cost of maintenance on a mileage basis, RS this user was reluctant to disclose the extent of idle time involved in the operation of the 12 vehicles.
Overhaul Once a Year.
The system of maintenance, however, is well worthy of note. The wagons are thoroughly overhauled in turn, so that each receives that attention Once per annum., They are painted every other year.
The overhaul is such that nothing, except adjustments to tappets, is needed throughout the year, and, as the mileage is about 36,000, the economy of this thorough-going method of handling repairs and maintenance is self-evident. The boilers are retubed every three years, but the bottom row of tubes is renewed every second year. This procedure has eliminated any tube trouble on the road.
Another of my interviewees, owning 11 steam wagons, conforms more nearly with what I should call an average user. He has petrol lorries, as well as steamers, and, but for the threat embodied in the Salter Report, would by now have some oilengined chassis as well.
His methods of assessing operat ing cost are of interest. The vehieles are depreciated evenly over a period of five years and the costs are calculated on a ton-mileage basis.
As an example of the method of assessing these costs, the following data relating to a year's operation of a six-Wheeled steamer are of interest :—Depreciation, £195; insurance and tax, £73; wages, £400; repairs, £75; total, £743 for 254 working days, which is equivalent to £2 18s. 7th per day. Tyres cost 2d. and fuel lid. per mile. The costs are calculated on the basis of £2 18s. 7th per day and 31d. per mile.
In another ease, for six months' use, wages accounted for £210 6s. 5d.; oil, waste and sundries, £4 19s. 2d. ; tyres, £12 17s 10th; fuel, £30 l3. 7d.; depreciation, £116 1s. 9d.; tax and insurance, £37 5s. Id.; and repairs, £9 11s. 9d.: total, £421 15s. 7d. The mileage covered by this vehicle was 3,848, so that the cost per mile was approximately 2s. 2d.
In this instance, each vehicle is overhauled at the end of three years and again at the end of the fifth year, being replaced at the end of the sixth year.
Small Annual Mileage.
The annual mileage of these vehicles is comparatively small, which would make it feasible to keep them at work for seven or eight years, and this used to be the operator's practice. He has found, however, that obsolescence :intervenes to make this prolonged use uneconomical.
A. third user, with only one steam wagon, nevertheless achieves results which are nearly as good as those of the enthusiast first named. Having only one wagon, he finds, as might he expected, that it is impracticable to carry out his own overhauls and, consequently, arranges, for the maker to do that work annually at a cost, he tells me, varying from £40 to £70.
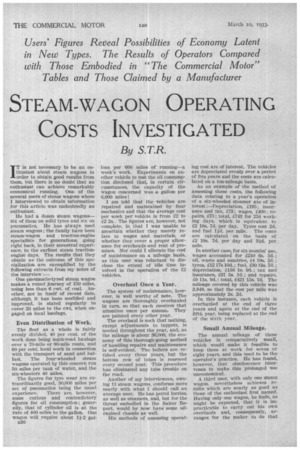
Large and small operators were amongst those consulted. A peculiarity of all but one is the high annual mileage achieved by the vehicles described. • In the accompanying table it will be noted that A and B cover distances that are quite small, compared with the others, and those two vehicles belong to one owner, Our Figures Disputed.
These interviews arise from a criticism, by a well-known steamwagon maker, of the figures in The Commercial Motor Tables of Operating Costs. It is claimed that users of the latest type of pneumatic-tyred steam wagon are able to operate their vehicles at a cost considerably less than that quoted in the Tables.
A short list of names of -users, selected by the manufacturer concerned was submitted. All the operators were communicated with and the outcome of the subsequent investigation is embodied in the table. All of them were not willing to disclose their operating costs, but those who were agreeable were extremely helpful. In the table are also included the figures from The Commercial Motor Tables, which were the subject of criticism, and the manufacturer's own data.
For the sake of simplicity, I have confined 'myself, in the published figures, to data relating to one type of vehicle-the rigid six-wheeler. The figures quoted are those actually supplied by users, except where otherwise definitely indicated in that table.
There are some curious features about these cost data, curious, but not surprising, to anyone who has had any experience of endeavouring to collect accurate details of cost from several users.
First of all, there is the wide variation between one user's experience and that of another, and even as between two vehicles operated by the same owner. Compare, for example, the cost per mile for fuel of vehicles A and B, which, as I have already stated, are operated by one owner. In one, the fuel cost is 1.25d. and, in the other, 1.92d., a difference of more than 50 per cent.
The variation in depreciation figures is even greater, but that is explained by difference in the method of calculation. The owner of vehicles A and B depreciates them on a five years' basis and covers a comparatively small mileage, which inevitably exaggerates the figure for depreciation per mile. None of the other users had any proper method of determining depreciation, and the figures quoted are calculated according to The Commercial Motor method on the basis of a life of 160,000 miles.
The figures for oil consumption are close. Only one figure departs considerably from the average and that is a figure obtained from the owner who is quoted earlier in this article as having some curious results to disclose.
Of the tyre costs, only two of the seven figures given are worthy of serious note. The figure of 2d. per mile for A and B is obviously an allowance, and not an actual cost. The figure for C relates to an actual and comparatively small expenditure on tyres incurred during a period of use, and may have no bearing whatever on the actual cost. Figures for F and G are only calculated.
Difference of Opinion.
There is no point in discussing the figures for maintenance. No two users have the same idea as to what is constituted in the term and it is rare to find two operators whose methods are such as to enable their figures to be compared.
Perhaps the most curious feature of the whole table is the way in which, notwithstanding the wide variations in individual items of cost, the average of the total cost approximates to within 1-10d. per mile to that given in The Commercial Motor Tables.
It is also of interest to compare The Commercial Motor figures with those of the critic and to note that, with reference to the four items that can usefully be compared, the mean of users' figures is the mean of those of The Commercial Motor and critic.
It is clear 'that it is possible to deal satisfactorily with the figures only for fuel, oil and tyres. Even in the case of fuel, there is the difficulty that some users give Ifigures for cost per mile, whilst others quote mileage per cwt., and neither class is willing to divulge the price paid for the fuel (except that one user said that he never found it worth while to pay under 43s. 64.).
I can, therefore, take only the figures for mileage per cwt. as a basis and apply my own figures for price of the fuel, according to The Commercial Motor Tables ; that is to say, 45s. per ton.
Fuel Consumption.
Only those relating to C, D and E are of any use in this respect, whilst It' and G are indeterminate, being those users' statements of mileage per cwt., without any backing in the shape of accountancy figures.
The average of those three is 16 in.p.cwt. It should be noted that they all relate to vehicles covering a large average annual mileage. For instance, C is continually operated over a straight run on good roads, doing 194 miles each way daily ; B is engaged on work almost the same; D mixes duty of a similar nature with local haulage. It is worthy of note that the last named, which does a certain amount of short-distance work, uses the most fuel per mile.
For vehicles regularly engaged on long-distance work, no doubt 16k nt.p.cwt. would be a fair average. On the other hand, 13-13k miles per cwt. is nearer that to be expected from vehicles on short-distance work. A fair all-round average is 15 m.p.cwt., or 1.80d. per mile. The figures for oil are practically the same as those given in the Tables, and, in any event, no criticism was offered on that item.
For tyre costs, the figures given for D and E may be taken as satisfactory, and 1.604. per mile for tyres would seem to meet the case.
Depreciation and maintenance are best left as they are in The Commercial Motor Tables and the complete set of running costs per mile is, therefore :-Fuel, 1.80d.; oil, 0.304.; tyres, 1.604.; maintenance, 1.804.; depreciation, 1.73d.; total, 7.234.