


THE COMMERCIAL MOTOR CENSUS FOR 1927.
Page 63
Page 64
Page 65
If you've noticed an error in this article please click here to report it so we can fix it.
An Analysis of the Commercial Motors in Great Britain, Obtained from the ,Registrations, and an Estimate of the Total Number of Commercial Motors in Use.
THE census of mechanically propelled road vehicles for the year 1927 -was published last month. by the Ministry of Transport, but owing to considerable pressure upon the spate in The Commercial Motor during the past few weeks we have been unable earlier to publish our comments upon the document. The matter, however, is one that is worthy of more than passing reference in our columns because there are many deductions to be drawn from the figures. Should it be necessary for any of our readers to obtain detailed figures for any particular county or other licensing area, the document can be purchased from H.M. Stationery Office at the price of 6d.
It will be remembered that in the issue of The (Jommercial Motor for April 19th, 1927, we dealt with the figures for the year 1926, and we propose to adopt the same form of reproduction in order that a comparison in detail can be effected by those readers who have filed that copy.
Why the Figures are Taken at September 30th.
The date of September 30th is chosen by the Ministry for elaborating the statistical data which are now obtainable from the fact that all motor vehicles have to be licensed, registered and re-registered each year, and it is probably the best date in the year to take because the licences current during that period include all the annual and current quarterly licences and all the part-year licences for those vehicles which are licensed for the latter months of the year, whilst ; on September 30th in any year it is highly likely that every, available motor coach is in commission.
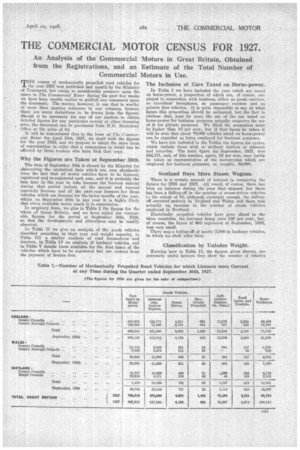
In =weary form, we give in Table I the figures for the "whole or Great Britain, and we have. added the comparable figures for the period at September 30th, 1926, so that the developments and alterationsmay be readily .observed. ; In Table II we give an analysis of the ;; goods vehicles classified according to their type and weight capacity, in Table III a similar analysis of road locomotives and tractors, in Table IV ha analysis of hackney vehicles, and in Table V details (now available for the. first time) of the vehicles which have to be registered but are exempt from
the payment of licence. fees. . ;
The Inclusion of Cars Taxed on Horse-power.
In Table I we have included the cars which are taxed on horse-power, a proportion of which are, of course, employed in connection with business, either as goods carriers, as travellers' broughams, as passenger carriers and as private hire vehicles. It is quite impossible to say at what figure this proportion should be estimated, but the fact is obvious that, year by year, the use of the ear taxed on horse-power for business purposes actually outgrows the use of it for private purposes. We think the proportion must be higher than 10 per cent. but if that figure be taken it will be seen that about 70,060 vehicles taxed on horse-power can he regarded as being employed for business purposes.
We have not included in the Tables the figures for cycles, which include those with or without trailers or sidecars and tricycles. The total figure for September, 1927, was 594,271, and, of this number, again, 10 per cent, may justly be taken as representative of the motorcycles which are employed for business purposes, or, roughly, 60,000.
Scotland Buys More Steam Wagons.
There is a .certain amount of interest in comparing the figures for 1926 and 1927. All round, of course, there has been an increase during the year that -elapsed, but there has been a falling-off in the number of steam-driven vehicles t.3 the extent of 93, although, curiously enough, the falling'off occurred entirely in England and Wales, and there was actually an increase in the number of steam vehicles employed in Scotland.
Electrically propelled vehicles have gone ahead in the three countries' the increase being over 100 per cent.' but, of course, the figure of 603 registered at September, 1926, was very small. There was a falling-off of nearly 5,000 in hackney vehicles, to which we shall refer later.
Classification by Unladen Weight.
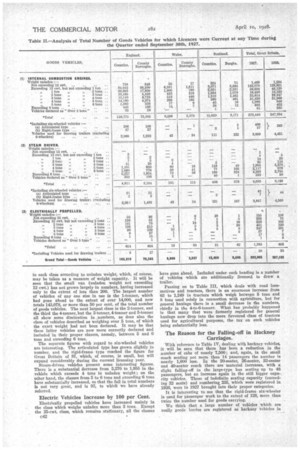
Turning how to Table II, the figures given therein are extremely useful because they show the number of vehicles
in each class according to unladen weight, which, of course, may be taken as a measure of weight capacity. It will be seen that the small van (unladen weight not exceeding 12 cwt.) has not grown largely in numberg, having increased only to the extent of less than 200. The largest number of vehicles of any one size in use is the 1-tonner, which had gone ahead to the extent of over 14,000, and now totals 143,078, or more than 50 per cent. of the total number of goods vehicles. The next largest class is the 2-tonner, and the third the 4-tonner, but the 3-tonner, 4-tonner and 5-tonner all show some diminution in numbers, as does also the class of vehicles described as weighing over 5 tons, of which the exact weight had not been declared. It may be that these latter vehicles are now more correctly declared and included in their proper classes, namely, between 5 and 6 tons and exceeding 6 tons.
The separate figures with regard to six-wheeled vehicles are interesting. The articulated type has grown slightly in number, and the rigid-frame type reached the figure for Great Britain of 57, which, of course, is small, but will expand considerably during the current licensing year.
Steam-driven vehicles present some interesting figures. There is a substantial decrease from 5,270 to 1,955 in the vehicle which exceeds 4 tons in unladen weight ; on the other hand, the classes from 5 to 6 tons and exceeding 6 tons have substantially increased, so that the fall in total numbers is not very great, and is 93, to which we have already referred.
Electric Vehicles Increase by 100 per Cent.
Electrically propelled vehicles have increased mainly in the class which weighs unladen more than 3 tons. Except the 25-cwt. class, which remains stationary, all the classes have gene ahead. Included under each beading is a number of vehicles which are additionally licensed to draw a trailer.
Passing on to Table III, which deals with road locomotives and tractors, there is an enormous increase from 63 to 1,249 in tractors which weigh between 5 tons and 8 tons used solely in connection with agriculture, but for general haulage there is a small decrease in the numbers, chiefly in the 4-to-6-tonner. What has probably happened is that many that were formerly registered for general haulage now drop into the more favoured class of tractors used for agricultural purposes, the tax on such vehicles being substantially less.
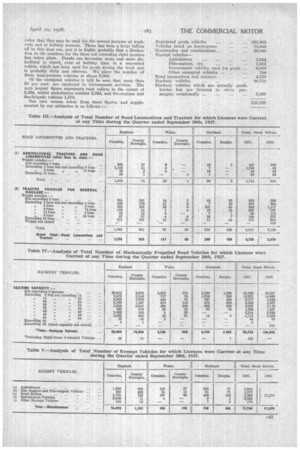
The Reason for the Falling-off in Hackney Carriages.
With reference to Table IV, dealing with hackney vehicles, it will be seen that there has been a reduction in the number of cabs of nearly 7,500; and, again, in the small coach seating not more than 14 passengers the number is neatly 1,000 less. In the 20-seater, 26-seater, 32-seater and 40-seater coach there are material increases, with a slight falling-off in the large-type bug seating up to 48 passengers, but an increase again in the still bigger capacity vehicles. Those of indefinite seating capacity (exceeding 32 seats) and numbering 235, which were registered in 1926, were in 1927 brought into their proper categories.
It is interesting to see that the rigid-frame six-wheeler is used for passenger work to the extent of 128, more than twice the number used for goods carrying.
We think that a large number of vehicles which are really goods lorries are registered as hackney vehicles in
order that they may be used for the second purpose at weekends and at holiday seasons. There has been a large felling off in this dual use, and it is highly probable that a diminution in the numbers for the 'class not exceeding eight persons has taken place. People are becoming more and more disinclined to travel, even at holiday time, in a converted vehicle which has been used for goods during the week and is probably dirty and odorous. We place the number of these dual-purpose vehicles at about 5,000.
Of the exempted vehicles it will be seen that more than 50 per cent, are employed in Government services. The next largest figure represents road rollers to the extent of 5,364, whilst ambulances number 2044,, and fire-engines and fire-brigade vehicles 1,573.
Our own census taken from these figures and supplemented by our estimates is as follows : Registered goods vehicles ... 282,905 Vehicles taxed on horse-power 70,000 Motorcycles and combinations... 60,000 Exempt vehicles Ambulances ... ... ... 2,644 Fire-engines, etc. ... ... ... 1,573 Government vehicles used for goods ... 6,000 Other exempted vehicles ... ... 150 Road locomotives and tractors... 4,759 Hackney vehicles ... ... ... ... 00,752 Hackney vehicles which are actually goods lorries but are licensed to . carry pas sengers occasionally ... ... ... ... 5,000 523,783