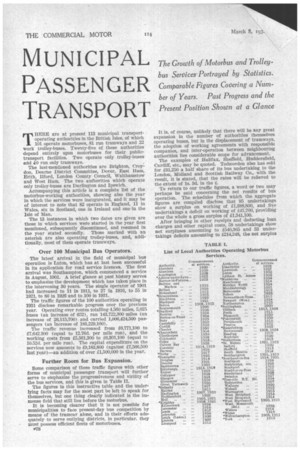
MUNICIPAL PASSENGER TRANSPORT
Page 86

Page 87

If you've noticed an error in this article please click here to report it so we can fix it.
The Growth of Motorbus and Trolleybus Services Portrayed by Statistics. Comparable Figures Covering a Number of Years. Past Progress and the Present Position Shown at a Glance
THERE are at present 113 municipal transportoperating authorities in the British Isles, of which 101 operate motorbuses, 81 run tramways and 22 work trolley-buses. Twenty-five of these authorities depend entirely upon motorbuses for their publictransport facilities. Two operate only trolley-buses
and aC) run only tramways. . The last-mentioned authorities are Brighton, Croydon, Dearne District Committee, Dover, East Ham, Erith, Ilford, London County Council, Walthainstow and West Ham. The two authorities which operate only trolley-buses are Darlington and Ipswich.
Accompanying this article is a complete list of the motorbus-working authorities, showing also the year in which the services were inaugurated, and it may be of interest to note that 82 operate in England, 11 in Wales, six in Scotland, one in Ireland and one in the Isle of Man.
The 13 instances in which two dates are given are those in which services were started in the year first mentioned, subsequently discontinued, and resumed in the year stated secondly. Those marked with an asterisk are also operating trolley-buses, and, additionally, most of them operate tramways.
Over 100 Municipal Bus Operators.
The latest arrival in the field of municipal bus operation Is Luton, which has at last been successful In its application for road service licences. The first arrival was Southampton, which commenced a service in August, 1901. A brief glance at past history serves to emphasize the development which has taken place in the intervening 30 years. The single operator of 1901 had increased to 11 in 1911, to 27 in 1916, to 55 in 1921, to 86 in 1926 and to 100 in 1931.
The traffic figures of the 100 authorities operating in 1931 disclose remarkable progress over the previous year. Operating over routes totalling 4,560 miles, 5,025 buses (an increase of 652), ran 143,722,300 miles (an Increase of 26,115,700) And carried 1,006,424,500 passengers (an increase of 183,229,100).
The traffic revenue increased from £6,771,100 to £7,642.300 (equal to 12.76d. per mile run), and the working costs from £5,561,300 to £6,301,100 (equal to 10.52d. per mile run). The capital expenditure on the services now amounts to £9,183,800 (against £7,566,500 last year)--an addition of over £1,500,000 in the year.
Further Room for Bus Expansion.
Some comparison of these traffic figures with other forms of municipal passenger transport will further serve to emphasize the progressiveness and virility of the bus services, and this is given in Table IL The figures in this instructive table and the underlying facts may for the most part be left to speak for themselves, but one thing clearly indicated is the immense field that still lies before the motorbus.
It is becoming clearer that it is not possible for municipalities to face present-day bus competition by means of the tramcar alone, and in their efforts adequately to serve outlying districts, in particular, they must possess efficient fleets of motorbuses.
ii.28 It is, of course, unlikely that there will be any great expansion in the number of authorities themselves operating buses, but in the displacement of tramways, the adoption of working agreements with responsible companies, and inter-operation between neighbouring authorities lies considerable scope for advancement.
The examples of Halifax, Sheffield, Huddersfield, Cardiff, etc., may be quoted. Todraorden also has sold for £31,250 a half share of its bus undertaking to the London, Midland and Scottish Railway Co., with the result, it is stated, that the rates will be relieved to the extent of 1s. 3d. in the £.
To return to our traffic figures, a word or two may perhaps be said concerning the net results of bus operation. The schedules from which the aggregate figures are compiled disclose that 95 undertakings show a surplus on working of £1,388,800, and five undertakings a deficit on working of £47,700, providing over the whole a gross surplus of £1,341,100.
After bringing in other receipts and deducting loan charges and other capital costs, 58 undertakings show net surpluses amounting to £540,365 and 33 undertakings deficits amounting to £214,248, the net surplus on all the 91 undertakings referred to being £326,117. Particulars of net-revenue charges are not separately specified in respect of the remaining mine undertakings, so that the figure of 1326,117 surplus must be regarded as subject to further deductions.
The progress which is being made in trolley-bus systems also is encouraging. Under present-day :traffic conditions and in their special sphere, trolley-buses offer municipal authorities a system' of local transport that is modern, economical and of great utility from more aspects than one. As will be seen from Table IL in the municipal year 1930-31, the 20 systems then in operation over 153 route-miles represented a capital
expenditure amounting to no less a sum than £1,614,765.
The 428 vehicles in service ran a2,881340 miles and carried over 129,000,000 passengers. The traffic revenue of £772,500 and the working costs of £575,430 indicate an average of 14.39d. and 10.72d. per bus-mile respectively. The following table shows how these compare with other forms "of municipal transport :—


