 1
1 2
2 3
3 4
4 5
5 6
6 7
7 8
8 9
9 10
10 11
11 12
12 13
13 14
14 15
15 16
16 17
17 18
18 19
19 20
20 21
21 22
22 23
23 24
24 25
25 26
26 27
27 28
28 29
29 30
30 31
31 32
32 33
33 34
34 35
35 36
36 37
37 38
38 39
39 40
40 41
41 42
42 43
43 44
44 45
45 46
46 47
47 48
48 49
49 50
50 51
51 52
52 53
53 54
54 55
55 56
56 57
57 58
58 59
59 60
60 61
61 62
62 63
63 64
64 65
65 66
66 67
67 68
68 69
69 70
70 71
71 72
72 73
73 74
74 75
75 76
76 77
77 78
78 79
79 80
80 81
81 82
82 83
83 84
84 85
85 86
86 87
87 88
88 89
89 90
90 91
91 92
92 93
93 94
94 95
95 96
96 97
97 98
98 99
99 100
100 101
101 102
102 103
103 104
104 105
105 106
106 107
107 108
108 109
109 110
110 111
111 112
112 113
113 114
114 115
115 116
116 117
117 118
118 119
119 120
120 121
121 122
122 123
123 124
124 125
125 126
126 127
127 128
128 129
129 130
130 131
131 132
132 133
133 134
134 135
135 136
136 137
137 138
138 139
139 140
140 141
141 142
142 143
143 144
144 145
145 146
146 147
147 148
148 149
149 150
150 151
151 152
152 153
153 154
154 155
155 156
156 157
157 158
158 159
159 160
160 161
161 162
162 163
163 164
164 165
165 166
166 167
167 168
168 169
169 170
170 171
171 172
172 173
173 174
174 175
175 176
176 177
177 178
178 179
179 180
180 181
181 182
182 183
183 184
184 185
185 186
186 187
187 188
188 189
189 190
190 191
191 192
192 193
193 194
194 195
195 196
196 197
197 198
198 199
199 200
200 201
201 202
202 203
203 204
204 205
205 206
206 207
207 208
208 209
209 210
210 211
211 212
212 213
213 214
214 PICKING THE BLACK SPOTS
Page 76
If you've noticed an error in this article please click here to report it so we can fix it.
As operators are pushed to include vehicle
movements in their risk management programme, Brian Weatherley looks at a
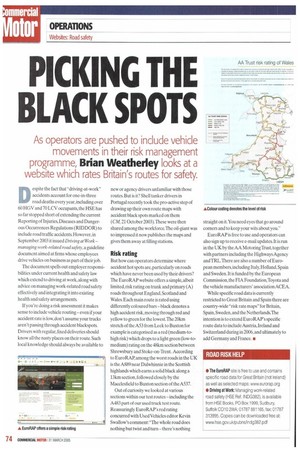
website which rates Britain's routes for safety.
Despite the fact that "driving-at-work" accidents account for one-in-three road deaths every year, including over 60 HGV and 70 LCV occupants, the HSE has so far stopped short of extending the current Reporting of Injuries,Diseases and Dangerous Occurrences Regulations (RIDDOR) to include road traffic accidents. However, in September 2003 it issued Driving at Work— managing work-related road safety, a guideline document aimed at firms whose employees drive vehicles on business as part of their job.
The document spells out employer responsibilities under current health and safety law which extend to driving at work, along with advice on managing work-related road safety effectively and integrating it into existing health and safety arrangements.
If you're doing a risk assessment it makes sense to include vehicle routing — even if your accident rate is low, don't assume your trucks aren't passing through accident blackspots. Drivers with regular, fixed deliveries should know all the nasty places on their route. Such local knowledge should always be available to new or agency drivers unfamiliar with those routes. But is it? Shell tanker drivers in Portugal recently took the pro-active step of drawing up their own route maps with accident black spots marked on them (CM, 21 October 2003). These were then shared among the workforce.The oil-giant was so impressed it now publishes the maps and gives them away at filling stations.
Risk rating
But how can operators determine where accident hot spots are,particularly on roads which have never been used by their drivers? The EuroRAP website offers a simple, albeit limited, risk rating on trunk and primary (A) roads throughout England,Scotland and Wales. Each main route is rated using differently coloured bars — black denotes a high accident risk,moving through red and yellow to green for the lowest.The 20km stretch of the A53 from Leek to Buxton for example is categorised as a red (medium-tohigh risk) which drops to a light green (low-tomedium) rating on the 481un section between Shrewsbury and Stoke-on-Trent. According to EuroRAP, among the worst roads in the UK is the A889 near Dalwhinnie in the Scottish highlands which earns a solid black along a 131un section, followed closely by the Macclesfield to Buxton section of the A537.
Out of curiosity we looked at various sections within our test routes — including the A483 part of our used truck test route. Reassuringly EuroRAP's red rating concurred with Used Vehicles editor Kevin Swallow's comment: "The whole road does nothing but twist and turn — there's nothing straight on it. You need eyes that go around corners and to keep your wits about you."
EuroRAP is free to use and operators can also sign up to receive e-mail updates. It is run in the UK by the AA Motoring Trust, together with partners including the Highways Agency and TRL.There are also a number of European members, including Italy,Holland.Spain and Sweden. It is funded by the European Commission, the HA Foundation,Toyota and the vehicle manufacturers' association ACEA.
While specific road data is currently restricted to Great Britain and Spain there are country-wide "risk rate maps" for Britain, Spain,Sweden, and the Netherlands.The intention is to extend EuroRAP's specific route data to includeAustria,Ireland and Switzerland during in 2006, and ultimately to add Germany and France. •