


Hidden Subsidies in Rural Bus Services
Page 62
Page 65
If you've noticed an error in this article please click here to report it so we can fix it.
The True Cost of Country Passenger Facilities May Not Be Apparent Because of Defective Analysis of Operating Expenses
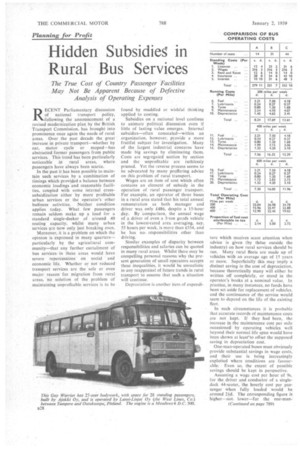
RECENT Parliamentary discussion of national transport policy, following the announcement of a revised modernization plan by the British Transport Commission, has brought into prominence once again the needs of rural areas. • Over the past decade the great increase in private transport-whether by car, motor cycle or moped-has abstracted former passengers from public services. This trend has been particularly noticeable in rural areas, where passengers have always been scarce.
In the past it has been possible to maintain such services by a combination of timings which provided a balance between economic loadings and reasonable facilities, coupled with some internal crosssubsidization either by more profitable urban services or the operator's other business activities. Neither condition applies today. What few passengers remain seldom make up a load for a standard single-decker of around 40 seating capacity, whilst many urban services are now only just breaking even, . Moreover, it is a problem on which the opinion is 'expressed in many quartersparticularly by the agricultural community-that any further curtailment of bus services • in these areas would have severe repercussions on social and economic life. Whether or not reduced transport services are the sole or even major reason for migration from rural areas, no solution of the problem of maintaining unprofitable services is to be found by muddled or wishful thinking applied to costing.
Subsidies on a national level continue to animate political discussion even if little of lasting value emerges. Internal subsidies-often concealed-within an organization, however; provide a more fruitful subject for investigation. Many of the largest industrial concerns have made big savings by eliminating them. Costs are segregated section by section and the unprofitable are ruthlessly pruned. Yet the reverse process seems to be advocated by many proffering advice on this problem of rural transport.
Wages are an item of cost which often contains an element of subsidy in the operation of rural passenger transport. For example, an operator of three buses in a rural area stated that his total annual remuneration as both manager and driver was only £486, despite a 15-hour day. By comparison, the annual wage of a driver of even a 3-ton goods vehicle in the lowest-rated area averaging, say, 55 hours per week, is more than £554, and he has noresponsibilities other than driving.
Similar examples of disparity between responsibilities and salaries can be quoted in many rural areas. Whilst there may be compelling personal reasons why the present generation of small operators accepts these inequalities, it would be unrealistic in any reappraisal of future trends in rural transport to assume that such a situation will continue.
Depreciation is another item of expendi ture which receives scant attention when advice is given (by those outside the industry) on how rural services should be run. Many rural fleets are made up of vehicles with an average age of 15 years or more. Superficially this may imply a distinct saving in the cost of depreciation, because theoretically many will either be written off completely, or stand in the operator's books at a nominal value, In practice, in many instances, no funds have been set aside for replacement of vehicles, and the continuance of the service would seem to depend on the life of the existing fleet.
In such circumstances it is probable that accurate records of maintenance costs are not kept. If they had been, the increase in the maintenance cost per mile occasioned by operating vehicles well beyond their normal life span would have been shown at leaseto offset the supposed saving in depreciation cost.
One-man-operated buses must obviously provide substantial savings in wage costs, and their use is being increasingly exploited where conditions are favourable: Even so, the extent of possible savings should be kept in perspective.
Assuming a wage cost per hour of 9s, for the driver and conductor of a singledeck 44-seater, the hourly cost per passenger when fully loaded would be around 24d. The corresponding figure is higher--not, lower-for the one-man
operated vehicle as soon as the number of passengers falls to 23 or less. With a load of 20, the cost per hour is more than 3d. per passenger, and many rural services carry much lighter loads.
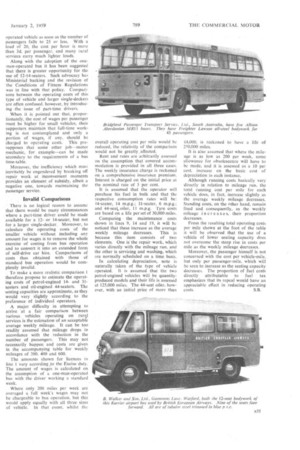
Along with the adoption of the onernan-operated bus it has been suggested that there is greater opportunity for the use of 12-14-seaters. Such advocacy has Ministerial backing and the revision of • the Conditions of Fitness Regulations was in tine with that policy. Comparisons between the operating costs of this type of vehicle and larger single-deckers are often confused, however, by introducing the issue of part-time drivers.
. When. it is pointed out that, proportionately, the cost of wages per passenger must be higher for small vehicles, their supPorters maintain that full-time working is not contemplated and only a portion of wages, if any, should be charged to operating costs. This presupposes' that some other job—motor mechanic, for example—can be made secondary to the requirements of a bus time-table.
Moreover, the inefficiency which must inevitably be engendered by breaking off repair work. at inconvenient moments provides an element of subsidy, albeit a negative one, towards maintaining the passenger service.
Invalid Comparisons
There is no logical reason to assume that there would be many circumstances where a part-time driver could be made available for a 12or 14-seater, but not for a larger single-decker. Moreover, to calculate the operating costs of the smaller vehicle without including an amount for wages is to remove the whole exercise of costing from bus operation and to convert it into an extended form of self-drive car hire. Comparisons of costs thus obtained with those of standard bus operation would be completely invalid.
• To make a more realistic comparison I therefore propose to estimate the operating costs of petrol-engined 14and 31seaters and oil-engined 44-seaters. The seating capacities are approximate, as they would vary slightly according to the preference of individual operators. A major difficulty in attempting to arrive at a fair comparison between ;various vehicles operating on rura..1 services is the'estimation of an acceptable average weekly mileage. It can be too readily assumed' that mileage drops in accordance with the reduction in the number of passengers. This may not necessarily happen and costs are given in the accompanying table for weekly mileages of 200, 400 and 600.
The amounts shown for licences in line 1 vary according to the Excise duty. The amount of wages is calculated on the assumption of a one-man-operated bus with the driver working a standard week.
Where only. 200 miles per week are averaged a full week's wages may not be chargeable to bus operation, but this would apply equally with all three sizes of vehicle. In that event. whilst the
overall operating cost per mile would he reduced, the relativity of the comparison would not tie greatly, affected.
Rent and rates are arbitrarily assessed on the assumption that covered accommodation is provided in all three cases. The weekly insurance charge is reckoned on a comprehensive insurance premium. Interest is charged on the initial price at the nominal rate of 3 per cent.
It is assumed that the operator will purchase his fuel in bulk and that the respective consumption rates will be: 14-seater, 14 m.p.g.; 31-seater, 6 m.p.g.; and 44-seat, oiler, 11 m.p.g. Tyre costs are based on a life per set of 30,000 miles.
Comparing the maintenance costs shown in lines 9, 14 and 19, it will be noticed that these increase as the average weekly mileage decreases. This is because this Item consists of two elements. One is the repair work, which varies directly with the mileage run, and the other is servicing and washing, which are normally scheduled on a time basis.
In calculating depreciation, note is naturally taken of the type of vehicle operated. It is assumed that the two petrol-engined vehicles will be quantityproduced models and their life is assessed at 125,000 miles. The 44-seat oiler. however, with an initial price of more than 1:4,000, is reckoned to have a life of 250,000 miles.
It is also assumed that where the mileage is as low as 200 per week, some allowance for obsolescence will have to be made, and it is assessed as a 10 per cent. increase on the basic cost of depreciation in each instance.
Although running costs basically vary directly in relation to mileage run, the total running cost per mile for each vehicle does, in fact. increase slightly as the average weekly mileage decreases. Standing costs, on the other hand, remain fixed and consequently, as the weekly mileage in s, their proportion decreases.
From the resulting total operating costs per mile shown at the foot of the table it will be observed that the use of a vehicle of lower seating capacity does not overcome the steep rise in costs per mile as the weekly mileage decreases,
Moreover, the passenger himself is not concerned with the cost per vehicle-mile, but only per passenger-mile, which will be seen to increase as the seating capacity decreases. The proportion of fuel costs directly attributable to fuel tax emphasizes that its repeal would have an appreciable effect in reducing operating costs. S.B.