 1
1 2
2 3
3 4
4 5
5 6
6 7
7 8
8 9
9 10
10 11
11 12
12 13
13 14
14 15
15 16
16 17
17 18
18 19
19 20
20 21
21 22
22 23
23 24
24 25
25 26
26 27
27 28
28 29
29 30
30 31
31 32
32 33
33 34
34 35
35 36
36 37
37 38
38 39
39 40
40 41
41 42
42 43
43 44
44 45
45 46
46 47
47 48
48 49
49 50
50 51
51 52
52 53
53 54
54 55
55 56
56 57
57 58
58 59
59 60
60 61
61 62
62 63
63 64
64 65
65 66
66 67
67 68
68 69
69 70
70 71
71 72
72 73
73 74
74 75
75 76
76 77
77 78
78 79
79 80
80 81
81 82
82 83
83 84
84 85
85 86
86 87
87 88
88 89
89 90
90 91
91 92
92 93
93 94
94 95
95 96
96 97
97 98
98 99
99 100
100 101
101 102
102 103
103 104
104 105
105 106
106 107
107 108
108 109
109 110
110 111
111 112
112 113
113 114
114 115
115 116
116 117
117 118
118 119
119 120
120 121
121 122
122 123
123 124
124 125
125 126
126 127
127 128
128 129
129 130
130 131
131 132
132 133
133 134
134 135
135 136
136 137
137 138
138 139
139 140
140 141
141 142
142 143
143 144
144 145
145 146
146 147
147 148
148 149
149 150
150 151
151 152
152 153
153 154
154 155
155 156
156 157
157 158
158 159
159 160
160 Tougher
Page 40
Page 41
If you've noticed an error in this article please click here to report it so we can fix it.
Ines ahead
The Road Haulage Association's latest Goods Vehicle Operating Cost Tables don't make pleasant reading. Julian
Nines reviews the facts behind the figures.
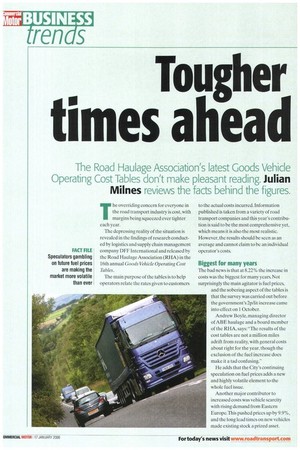
The overriding concern for everyone in the road transport industry is cost, with margins being squeezed ever tighter each year.
The depressing reality of the situation is revealed in the findings of research conducted by logistics and supply chain management company OFF International and released by the Road Haulage Association (RHA) in the 16th annual Goods Vehicle Operating Cost Tables.
The main purpose of the tables is to help operators relate the rates given to customers to the actual costs incurred. Information published is taken from a variety of road transport companies and this year's contribution is said to be the most comprehensive yet, which means it is also the most realistic. However, the results should be seen as an average and cannot claim to be an individual operator's costs.
Biggest for many years
The had news is that at 8.22% the increase in costs was the biggest for many years. Not surprisingly the main agitator is fuel prices, and the sobering aspect of the tables is that the survey was carried out before the government's 2p/lit increase came into effect on 1 October.
Andrew Boyle, managing director of ABE haulage and a board member of the RHA, says: "The results of the cost tables are not a million miles adrift from reality, with general costs about right for the year, though the exclusion of the fuel increase does make it a tad confusing."
He adds that the City's continuing speculation on fuel prices adds a new and highly volatile element to the whole fuel issue.
Another major contributor to increased costs was vehicle scarcity with rising demand from Eastern Europe. This pushed prices up by 9.9%, and the long lead times on new vehicles made existing stock a prized asset. Driver employment costs rose 5.9%, when ttking into account increased holiday entitlements, training and the use of agency rd l ef drivers Brian Fish, director at DFF International, believes several factors have contributed to the startling increase in costs:"ProbIem areas in transport costing which are espc ci,Ty prevalent include a failure to deter, e how many working days and hours vehicles are really earning money against time-related costs, which are typically at least 60% of total costs."
Fillure to quantify
Fish also points to a failure to quantify overheads and apportion them across the revenue-earning fleet and the often used but dangerously misleading cost or rate per mile.
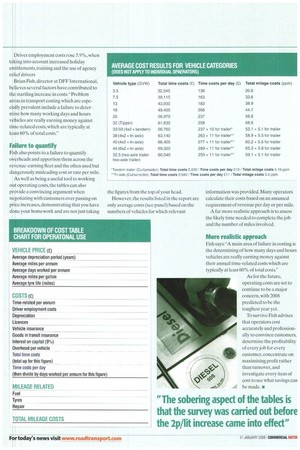
As well as being a useful tool to working out operating costs, the tables can also provide a convincing argument when negotiating with customers over passing on price increases, demonstrating that you have dope your homework and are not just taking the figures from the top of your head. However, the results listed in the report are only average costs (see panel) based on the numbers of vehicles for which relevant information was provided. Many operators calculate their costs based on an assumed requirement of revenue per day or per mile.
A far more realistic approach is to assess the likely time needed to complete the job and the number of miles involved.
More realistic approach
Fish says "A main area of failure in costing is the determining of how many days and hours vehicles are really earning money against their annual time-related costs which are typically at least 60% of total costs."
As for the future, operating costs are set to continue to be a major concern, with 2008 predicted to be the toughest year yet.
To survive Fish advises that operators cost accurately and professionally to convince customers, determine the profitability • of every job for every customer, concentrate on customer, concentrate on maximising profit rather than turnover, and investigate every item of cost to see what savings can A be made. •