


What the new cost tables reveal
Page 46
Page 49
If you've noticed an error in this article please click here to report it so we can fix it.
WORKING WEEKS REDUCED 10 45 A YEAR
The first in a new series of special CM features on costs for road transport operators Commercial Motor published the first edition of its Tables of Operating Costs as far back as 1911. The intervening 58 years have seen a complete change in the overall pattern of transport in the United Kingdom, with road transport becoming the outstandingly major section. Now road transport itself is in the throes of major changes and, more than ever before, a businesslike approach to haulage and own-account operation, with trading based on accurate knowledge of costs, is essential.
The new edition of the CM Tables of Operating Costs will be published later this month, providing information about costs and charges which many operators will use as a basis of their own costing systems, or as a yardstick against which to measure their own figures. It is instructive to take a look at what the 1969 figures will show.
In announcing publication of the 1968 edition of the Tables, it was stated that seldom had there been so many changes in road transport in one year which affected costs, As a result there was a substantial increase in operating costs.
Taking as an example a medium-sized goods vehicle with a payload of 7 tons averaging 600 miles a week, the operating cost per mile was 19.73d in 1967. In 1968 it had risen to 21.73d, an increase of just 2.00d a mile, equivalent to 10.14 per cent.
After such a substantial rise in costs in one year, it would have been reasonable to expect a relative lull in changes affecting costs in 1969. The latest edition of the Tables now being published shows otherwise.
To operate a 7-tonner in 1969 now costs 23.95d a mile, an extra 2.22d a mile, equivalent to 10.22 per cent over 1968. Compared with 1967, the cumulative increase over the two years has been more than 21 per cent.
The cost of fit vehicles Even in an inflationary era when one is in danger of being conditioned to accept rising costs as the natural order of things, increases of this size are exceptional. As is to
be expected, there have been several contributory factors. One major factor which has contributed to yet another sharp rise in costs in 1969 is the reduced availability of vehicles to provide the service or earn the revenue for which they were purchased. There are several reasons for this.
Responsible operators are now making every effort to ensure that their vehicles pass the statutory fitness test as to their mechanical condition. Even those who previously have had an exemplary record as to the maintenance of their vehicles will want to make doubly sure that their vehicles pass the test. In so doing they will have to pay the price in both time and money. Vehicles will have to be taken out of service for the pre-test check-up as well as the test itself. In between times a higher standard of inspection and preventive maintenance will have to be practised if test standards are to be kept week-in-week-out.
Unfortunately, but inevitably, this new and widespread drive for higher maintenance standards has aggravated the shortage, which already existed, of both the labour and materials on which maintenance depends. Operators' experience over the past year has shown this to be the trend even before commercial vehicle testing was fully implemented. As a result, non-availability of vehicles for service has been still further increased while operators wait for either spares or skilled labour—or both—to finish the job.
Therefore, to compensate for this increase in the time when vehicles are not available for service, the "working year" has been reduced from 48 weeks, as applied last year. to 45 weeks (or the equivalent of 225 working days on the basis of a five-day week) in this new 1969 edition of the Tables.
Basic factors To demonstrate the effect of this change on total operating costs, it is necessary to describe briefly one of the basic factors underlying the compiling of these Tables.
Commercial vehicle operation can be said to consist of two fundamental elements —time and mileage. This division is reflected in a corresponding division of the total cost of operating a commercial vehicle. Accordingly, operating costs—that is those costs directly attributable to individual vehicles—are separated into standing costs and running costs. Standing costs reflect the time element. They are costs which have to be met throughout the period a vehicle is in its operator's possession, regardless of whether it is being gainfully operated or not, or even whether it is being operated at all.
Running costs, in contrast, occur only when a vehicle is being operated, i.e. when the wheels are turning. But they still arise whether the journey is worth while or not.
Down to 45 weeks For many editions of the Tables, the number of working weeks was reckoned as 50. Then it became necessary to reduce it to 48. Now with the implementation of stringent vehicle testing regulations it is evident from operators' reports that 45 working weeks (or 225 working days on the basis of a five-day week) would be more appropriate to present-day standards.
The importance given to determining the number of working weeks is because of its effect on revenue or—the equivalent of revenue—the standard of service provided. Knowing that, on average, vehicles will not be earning their keep for more than 45 weeks in the year, operators will have to take sufficient revenue in those 45 weeks to provide for the whole of the standing,costs, together with all other expenditure and profit margin.
Compared with 1968 when a 48-week year applied, this adjustment to a 45-week year adds, of itself, over 6 per cent to standing costs as a whole. This increase is irrespective of any increase which may have occurred over the past year to individual items of standing costs.
Dealing now with these individual items, it has proved both convenient and practical to divide total standing costs into five items: licences, wages, rent and rates, insurance and interest.
Last year the excise duty on goods veh ides was substantially increased; on most of them by a swingeing 50 per cent. While there has been no further increase in 1969, last year's big increase in the excise duty on goods vehicles continues to have a marked effect on the cost of their operation,
On February 1 1969, the fees for public service vehicle licences were raised from 18 lOs to £12 lOs and the certificates of fitness for those vehicles from £5 lOs to £6 10s. The proportional increases have accordingly been included, where applicable, in the licence cost of passenger vehicles.
Wages, as an item of cost, present difficulties when compiling the Tables of Operating Costs. Wide variations occur both in the method of calculation and the amount of extra payment made. Nor is this extra amount directly related to mileage run, as delays in traffic and on collection and delivery continue to restrict operators' endeavours to achieve higher productivity.
Wages are basic On balance, therefore, it is considered more helpful to users of this new edition of the Tables for a basic amount to be included as wages. Then additional payments can be added by the user to meet his individual circumstances. To facilitate this a ready reckoner is provided in the new edition of the Tables with an extended range to convert weekly variations (E. s) into an operating cost per mile (pence. to two decimal places). In addition to wages it can be used to adjust any of the other four items of standing costs.
Another item of standing costs to be adjusted in this 1969 edition is that of interest on the capital outlay on a new vehicle, the rate of interest being increased from 9 per cent in 1968 to 10 per cent in line with the rising Bank Rate.
In addition to this straight increase of 1 per cent. however, there has been further adjustment to this item of standing costs as the average price of vehicles varied as between 1968 and 1969.
A new look at prices Because of the effect of plating and testing regulations, as well as competitive factors, there have been substantial changes in the range of standard vehicles available to operators and the prevailing prices. Accordingly. the averaging of prices for this new edition was undertaken comprehensively and in detail.
In many cases an increase in the average prices has resulted. But apparent anomalies can occur. If, for example, as compared with last year, one or more of the higher priced vehicles in any particular group is no longer available, the average price this year could be lower, though probably only marginally.
Dealing now with increases in running costs included in this new edition of the Tables, the first and—unfortunatelyalmost inevitable example is that of fuel. In 1968 the duty per gallon was 3s lid; in the 1969 edition it amounts to 4s 6d a gallon, an increase of nearly 13 per dent. The resulting total prices of fuel used in the Tables (with the 1968 prices in brackets) are: Petrol: Commercial 6s Od (5s 5d); Cars 6s 6d (5s 10+d).
Derv: 6s 0-led (5s 541d).
Lubricant costs have increased by approximately 5 per cent over the past year and there has been a similar increase in tyre costs recently.
One effect of the increasing implementation of more stringent statutory regulations as to vehicle fitness is a substantial rise in maintenance costs.
This is in addition to increases which have occurred over the past year in actual wages paid to repair staff in a competitive labour market. There is also the cost of location—and often special collection—of parts in short supply. Accordingly, 10 per cent has been added to the maintenance costs of vehicles not affected by the new statutory requirements and 20 per cent to those that are.
The method of calculating depreciation costs on a mileage basis remains the same. The comments made earlier as regards vehicle prices in connection with interest also apply to the cost of depreciation.
Finally, the layout of the Tables showing the cost of operating articulated vehicles has been adjusted to meet changing needs. With the growing emphasis on the use of the larger artic outfits with both van and tipper semi-trailers have been included for the first time. Also included for the first time art an 8-ton four-wheel and a 15-ton eight-wheel rigid tipper.
All in all, this new edition of the Tables, together with allied data and addresses, remains a standard publication for road transport operators anxious to be kept up to date with changes in the cost of operating commercial vehicles.
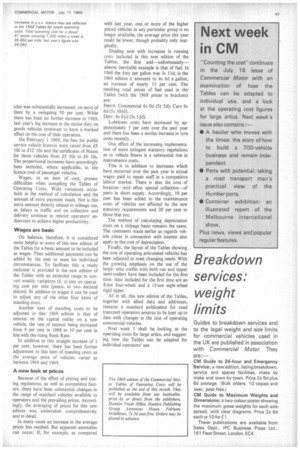
Next week I shall be looking at the operating costs for large artics, and suggesting how the Tables can be adapted for individual operators' use.