 1
1 2
2 3
3 4
4 5
5 6
6 7
7 8
8 9
9 10
10 11
11 12
12 13
13 14
14 15
15 16
16 17
17 18
18 19
19 20
20 21
21 22
22 23
23 24
24 25
25 26
26 27
27 28
28 29
29 30
30 31
31 32
32 33
33 34
34 35
35 36
36 37
37 38
38 39
39 40
40 41
41 42
42 43
43 44
44 45
45 46
46 47
47 48
48 49
49 50
50 51
51 52
52 53
53 54
54 55
55 56
56 57
57 58
58 59
59 60
60 61
61 62
62 63
63 64
64 65
65 66
66 67
67 68
68 69
69 70
70 71
71 72
72 73
73 74
74 75
75 76
76 77
77 78
78 79
79 80
80 81
81 82
82 83
83 84
84 85
85 86
86 87
87 88
88 89
89 90
90 91
91 92
92 93
93 94
94 95
95 96
96 97
97 98
98 99
99 100
100 101
101 102
102 103
103 104
104 105
105 106
106 107
107 108
108 109
109 110
110 111
111 112
112 113
113 114
114 115
115 116
116 117
117 118
118 119
119 120
120 121
121 122
122 123
123 124
124 125
125 126
126 127
127 128
128 129
129 130
130 131
131 132
132 133
133 134
134 135
135 136
136 137
137 138
138 139
139 140
140 141
141 142
142 143
143 144
144 145
145 146
146 147
147 148
148 149
149 150
150 151
151 152
152 153
153 154
154 155
155 156
156 HOW ROAD PASSENGER T ANSPORT STANDS TO-DAY
Page 82
Page 83
Page 84
Page 85
If you've noticed an error in this article please click here to report it so we can fix it.
THE conflict of interests between combine and independent operators is likely to be intensified by the movement that is gaining ground for the con
trol of large companies profits. Several suggestions have been made during recent months to the effect that the combines are paying excessive dividends and that, therefore, the travelling public is being made to suffer to satisfy a comparatively small body of shareholders.
We do not propose to argue the facts of the case, but are bound to point out that there seems to be a significant ministerial interest in passenger-transport com
panies' returns. The Minister of Transport is proposing, in the face of strong opposition from operators, to publish the individual returns furnished under the 1930 Act by passenger-vehicle owners—an action that suggests that, in his opinion, the public should know exactly how much money the various companies are earning.
Whilst independent operators would obviously object to the control of their own profits, they would probably welcome some restriction on the earnings of their larger competitors. This is an issue which, if brought to a head, is likely still further to widen the breach between the two interests.
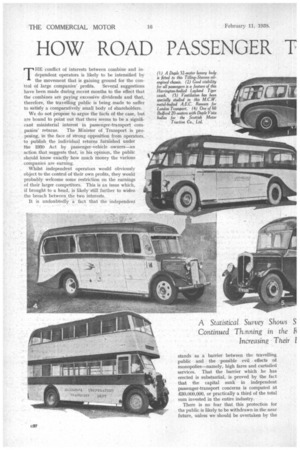
It is undoubtedly a fact that the independent
stands as a barrier between the travelling public and the possible evil effects of monopolies—namely, high fares and curtailed services. That the barrier which he has erected is substantial, is proved by the fact that the capital sunk in independent passenger-transport concerns is computed at £30,000,000, or practically a third of the total sum invested in the entire industry.
There is no fear that this protection for the public is likely to be withdrawn in the near future, unless we should be overtaken by the
calamity of nationalization. A contributor to The Commercial Motor recently estimated that, at the present rate of absorption, it will require 12-15 years for the combines to take over all the existing independent operators. The cost would be prodigious.
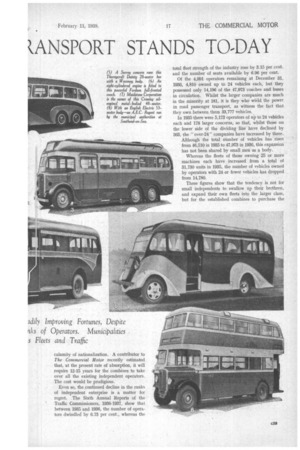
Even so, the continued decline in the ranks of independent enterprise is a matter for regret. . The Sixth Annual Reports of the Traffic Commissioners, 1936-1937, show that between 1935 and 1936, the number of operators dwindled by 6.73 per cent., whereas the total fleet strength of the industry rose by 3.15 per cent. and the number of seats available by 6.96 per cent.
Of the 4,991 operators remaining at December 31, 1936, 4,810 owned up to 24 vehicles each, but they possessed only 14,196 of the 47,973 coaches and buses in circulation. Whilst the larger companies are much in the minority at 181, it is they who wield the power in road passenger transport, as witness the fact that they own between them 33,777 vehicles.
In 1935 there were 5,173 operators of up to 24 vehicles each and 178 larger concerns, so that, whilst those on the lower side of the dividing line have declined by 363, the " over-24 " companies have increased by three. Although the total number of vehicles has risen from 46,510 in 1935 to 47,973 in 1936, this expansion has not been shared by small men as a body.
Whereas the fleets of those owning 25 or more machines each have increased from a total of 31,730 units in 1935, the number of vehicles owned by operators with 24 or fewer vehicles has dropped from 14,780.
These figures show that the tendency is not for small independents to swallow up their brethren, and expand their own fleets into the larger class, but for the established combines to purchase the businesses of the small men or merge them with their own.
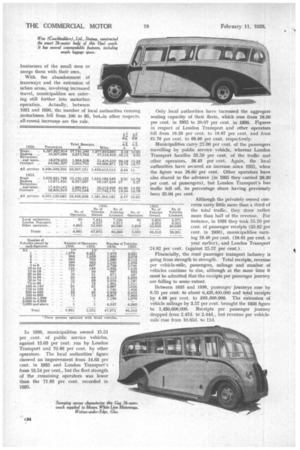
With the abandonment of tramways and the extension of urban areas, involving increased travel, municipalities are entering still further into motorbus operation. Actually, between 1931 and 1936, the number of local authorities running motorbuses fell from 100 to 95, but.in other respects, all-round increases are the rule.
In 1936, municipalities owned 15.51 per _cent. of public service vehicles, against 13.63 per cent. run by London Transport and 70.86 per cent. by other operators. The local authorities' figure showed an improvement from 14.63 per cent. in 1935 and London Transport's from 13.54 per cent., but the fleet strength of the remaining operators was lower than the 71.&1 per cent, recorded in 1935.
Only local authorities have Increased the aggregate seating capacity of their fleets, which rose from 18.96 per cent. in 1935 to 20.07 per cent. in 1936. Figures in respect of London Transport and other operators fell from 19.28 per cent. to 19.07 per cent, and from 61.76 per cent. to 60.86 per cent. respectively.
• Municipalities carry 27.96 per cent. of the passengers travelling by public service vehicle, whereas London Transport handles 33.59 per cent, of the traffic and other operators, 38.45 per cent. Again, the local authorities have secured an increase since 1935, when the figure was 26.60 per cent. Other operators have also shared in the advance (in 1935 they carried 38.36 per cent. of passengers), but London Transport's bus traffic fell off, its percentage share having previously been 35.04 pet cent.
Although the privately owned concerns carry little more than a third of the total traffic, they draw rather more than half of the revenue. For instance, in 1936 they took 55.70 per cent, of passenger receipts (55.82 per cent. in 1936), municipalities earning 19.48 per cent. (18.61 per cent. a year earlier), and London Transport 24.82 per cent. (against 25.57 per cent.).
Financially, the road passenger transport industry is going from strength to strength. Total receipts, revenue per vehicle-mile, passengers., mileage and number of vehicles continue to rise, although at the same time it must be admitted that the receipts per passenger journey are falling to some extent.
Between 1935 and 1936, passenger journeys rose by 6.55 per cent. to about 6,426,400,000 and total receipts by 4.98 per cent. to £65,600,000. The extension of vehicle mileage by 3.57 per cent. brought the 1986 figure to 1,430,600,000. Receipts per passenger journey dropped from 2.47d. to 2.44d., but revenue per vehiclemile rose from 10.854. to 11d.
No. of Vehicles Licensed.
6,806 6,571 6.295 6,001 33,409 26,629 46,510
_
39,201
Obviously the bulk of road passengers go by stage carriage, 6,327.8 million having travelled by this form of vehicle in 1936. Contract carriages claim the next highest total (64.1 million), 'followed by excursions and tours with 18.3 million and express services with 16.2 million. All these figures are increases over those for 1935, the biggest jump (8.97 per cent.) being in respect of contract work.
Most Revenue From Stage Carriages.
Receipts do, not follow the same order, for, although stage services head the list with £57.8 niillion, with contract carriages lying second at £3.4 million, express services occupy third place (22.4 million) and excursions and tours come last (£2 million). Again the biggest increase accrues to owners of contract carriages, who enjoyed 'a. rise of 10.7 per cent, in receipts between 1935 and 1936.
Mileage covered on all services, except in the 'express category, has risen, the stage-carriage figure of 1,277.9 million representing an improvement of 3.54 per cent., the excursion and tour mileage of 31.4 million an improvement of 3.64 per cent, and the contract figure of 64 million an advance of 10.88 per cent. Restrictions on and co-ordination of express services have, however, had the effect of cutting down mileage by 3.06 per cent. to 57.3 million.
In 1936, the average fare paid by stage-carriage passengers was 2.18d. (2.21d. in 1935), against 35.12d. (37d.) on express services, 26.18d. (25.96d.) on excursions and tours and 12.74d. (12,.54d.) on contract outings. To obtain the highest figure per passenger does
not, however, imply the most favourable result per vehicle mile, because on the latter basis, express services earned only 9.95d., against 10.85d. on stage carriages, 15.24d. on excursions and tours and 12.77d. on private parties. Except in the case of contract work, all these figures represent slight advances on those for 1935.
London 'Transport, as Britain's largest road-transport undertaking, calls for special mention. The Board's annual returns contain figures for rolling stock, mileage, receipts and so on, that, only a couple of decades ago, might have been applied to the whole industry.
London Transport's 6,500 Vehicles.
For instance, at June 30, 1937, the Board owned 6,454 coaches and buses (having 317,061 seats), not to mention 594 trolleybuses and 2,060 trams. These buses and coaches covered 269,480,519 miles in a year, carrying 2,018,835,514 passengers and bringing in a revenue of £15,217,707. Working expenses stood at £12,871,558.
The figures alone contained in this article afford an illuminating picture of the position and trend of the road passenger transport industry, and of the allocation of its work and wealth to the various departments and interests that go to make up a vast national movement. Combined with the brief explanatory notes given above, they provide a compact guide to the fortunes of the industry and one that will repay care:fill Study They show that passenger travel by coach and bus has become an integral part of the nation's social and business life, and emphasize the industry's importance as an employer of labour and a circulator of currency.